Estimated Value: $189,110 - $205,000
3
Beds
1
Bath
1,371
Sq Ft
$144/Sq Ft
Est. Value
About This Home
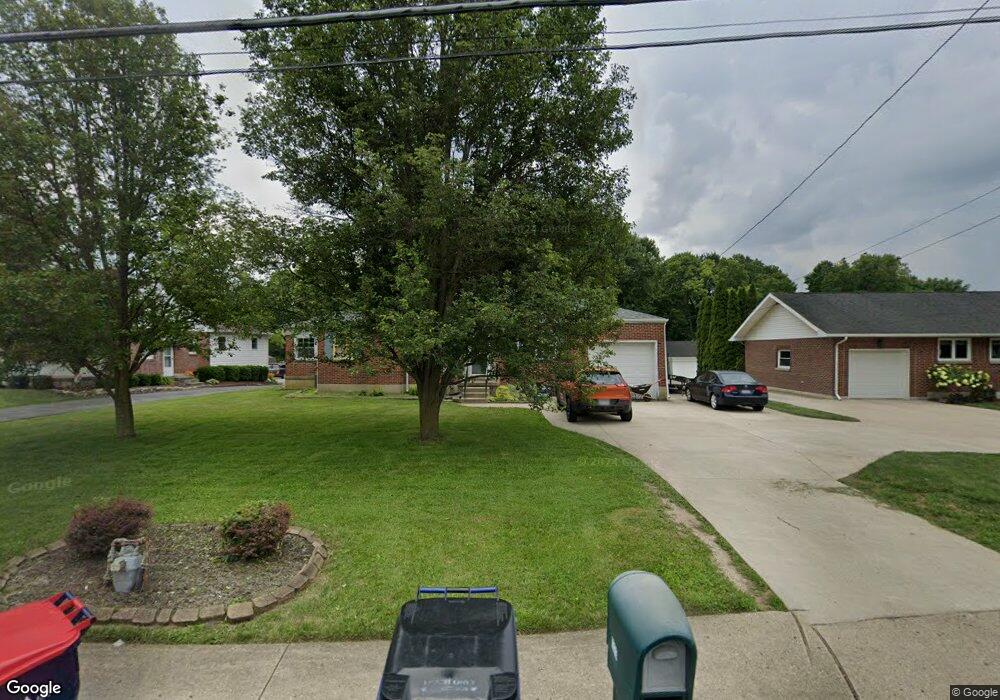
This home is located at 1229 W High St, Piqua, OH 45356 and is currently estimated at $197,778, approximately $144 per square foot. 1229 W High St is a home located in Miami County with nearby schools including Washington Primary School, Piqua Junior High School, and Piqua High School.
Ownership History
Date
Name
Owned For
Owner Type
Purchase Details
Closed on
Nov 4, 2011
Sold by
Critz Steven G and Critz Jessica N
Bought by
Potter Edward R
Current Estimated Value
Home Financials for this Owner
Home Financials are based on the most recent Mortgage that was taken out on this home.
Original Mortgage
$68,225
Outstanding Balance
$46,680
Interest Rate
4.09%
Mortgage Type
FHA
Estimated Equity
$151,098
Purchase Details
Closed on
Sep 12, 2006
Sold by
Pearce John F and Pearce Jackie L
Bought by
Parker Jessica N and Critz Steven G
Purchase Details
Closed on
Nov 28, 2001
Sold by
Keener David L
Bought by
Pearce John F and Pearce Jackie L
Purchase Details
Closed on
Jun 22, 1999
Sold by
Brown Cyril J
Bought by
Keener David L
Purchase Details
Closed on
Apr 28, 1999
Sold by
Brown Thomas D
Bought by
Brown Cyril J
Purchase Details
Closed on
Jan 1, 1990
Bought by
Brown Cyril J
Create a Home Valuation Report for This Property
The Home Valuation Report is an in-depth analysis detailing your home's value as well as a comparison with similar homes in the area
Home Values in the Area
Average Home Value in this Area
Purchase History
| Date | Buyer | Sale Price | Title Company |
|---|---|---|---|
| Potter Edward R | $70,000 | -- | |
| Parker Jessica N | $100,000 | -- | |
| Pearce John F | $91,625 | -- | |
| Keener David L | $87,300 | -- | |
| Brown Cyril J | -- | -- | |
| Brown Cyril J | -- | -- |
Source: Public Records
Mortgage History
| Date | Status | Borrower | Loan Amount |
|---|---|---|---|
| Open | Brown Cyril J | $68,225 |
Source: Public Records
Tax History Compared to Growth
Tax History
| Year | Tax Paid | Tax Assessment Tax Assessment Total Assessment is a certain percentage of the fair market value that is determined by local assessors to be the total taxable value of land and additions on the property. | Land | Improvement |
|---|---|---|---|---|
| 2024 | $1,921 | $46,730 | $12,850 | $33,880 |
| 2023 | $1,921 | $46,730 | $12,850 | $33,880 |
| 2022 | $1,954 | $46,730 | $12,850 | $33,880 |
| 2021 | $1,583 | $34,620 | $9,520 | $25,100 |
| 2020 | $1,551 | $34,620 | $9,520 | $25,100 |
| 2019 | $1,560 | $34,620 | $9,520 | $25,100 |
| 2018 | $1,242 | $26,320 | $9,520 | $16,800 |
| 2017 | $1,257 | $26,320 | $9,520 | $16,800 |
| 2016 | $1,243 | $26,320 | $9,520 | $16,800 |
| 2015 | $1,272 | $26,320 | $9,520 | $16,800 |
| 2014 | $1,272 | $26,320 | $9,520 | $16,800 |
| 2013 | $1,277 | $26,320 | $9,520 | $16,800 |
Source: Public Records
Map
Nearby Homes