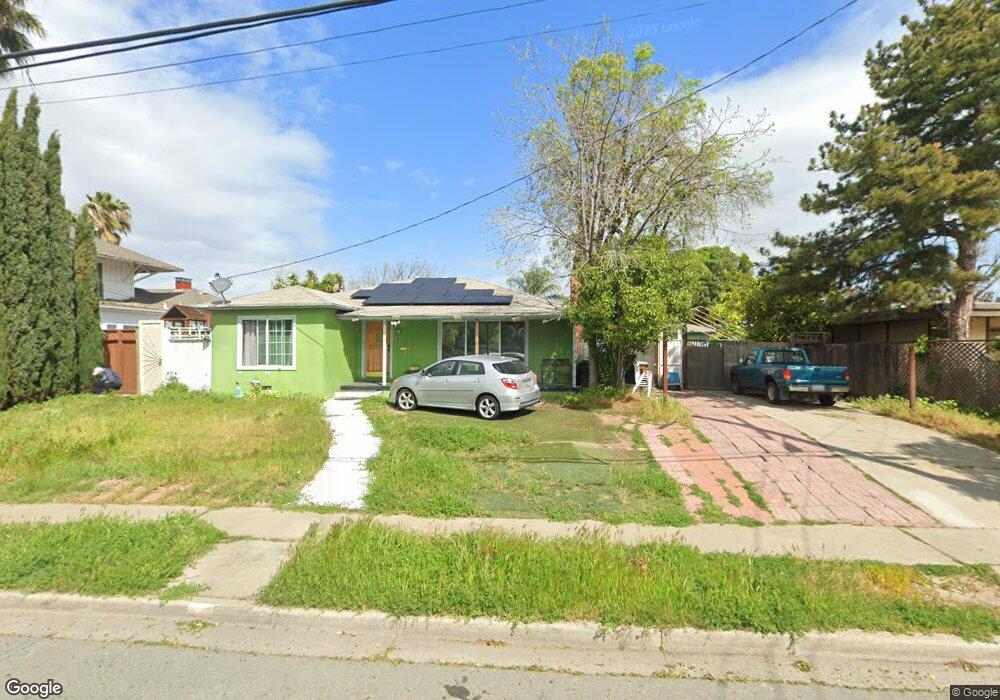
123 Beede Way Antioch, CA 94509
North Antioch NeighborhoodEstimated Value: $529,000 - $580,991
2
Beds
2
Baths
1,740
Sq Ft
$313/Sq Ft
Est. Value
About This Home
This home is located at 123 Beede Way, Antioch, CA 94509 and is currently estimated at $543,998, approximately $312 per square foot. 123 Beede Way is a home located in Contra Costa County with nearby schools including Kimball Elementary School, Antioch Middle School, and Antioch High School.
Ownership History
Date
Name
Owned For
Owner Type
Purchase Details
Closed on
May 5, 2023
Sold by
Monchatre Rene
Bought by
Monchatre Rene and Monchatre Blanca H
Current Estimated Value
Purchase Details
Closed on
Jun 3, 2002
Sold by
Fizulich Zeljko Jim
Bought by
Monchatre Rene
Home Financials for this Owner
Home Financials are based on the most recent Mortgage that was taken out on this home.
Original Mortgage
$23,523
Interest Rate
6.89%
Mortgage Type
Unknown
Create a Home Valuation Report for This Property
The Home Valuation Report is an in-depth analysis detailing your home's value as well as a comparison with similar homes in the area
Home Values in the Area
Average Home Value in this Area
Purchase History
| Date | Buyer | Sale Price | Title Company |
|---|---|---|---|
| Monchatre Rene | -- | None Listed On Document | |
| Monchatre Rene | -- | First American Title Ins Co |
Source: Public Records
Mortgage History
| Date | Status | Borrower | Loan Amount |
|---|---|---|---|
| Previous Owner | Monchatre Rene | $23,523 |
Source: Public Records
Tax History Compared to Growth
Tax History
| Year | Tax Paid | Tax Assessment Tax Assessment Total Assessment is a certain percentage of the fair market value that is determined by local assessors to be the total taxable value of land and additions on the property. | Land | Improvement |
|---|---|---|---|---|
| 2025 | $4,430 | $354,911 | $150,515 | $204,396 |
| 2024 | $4,430 | $347,953 | $147,564 | $200,389 |
| 2023 | $4,237 | $341,131 | $144,671 | $196,460 |
| 2022 | $4,171 | $334,443 | $141,835 | $192,608 |
| 2021 | $4,006 | $327,886 | $139,054 | $188,832 |
| 2019 | $14,917 | $318,163 | $134,931 | $183,232 |
| 2018 | $3,816 | $311,926 | $132,286 | $179,640 |
| 2017 | $3,719 | $305,811 | $129,693 | $176,118 |
| 2016 | $3,635 | $299,815 | $127,150 | $172,665 |
| 2015 | $3,595 | $258,000 | $109,417 | $148,583 |
| 2014 | $7,141 | $231,000 | $97,966 | $133,034 |
Source: Public Records
Map
Nearby Homes