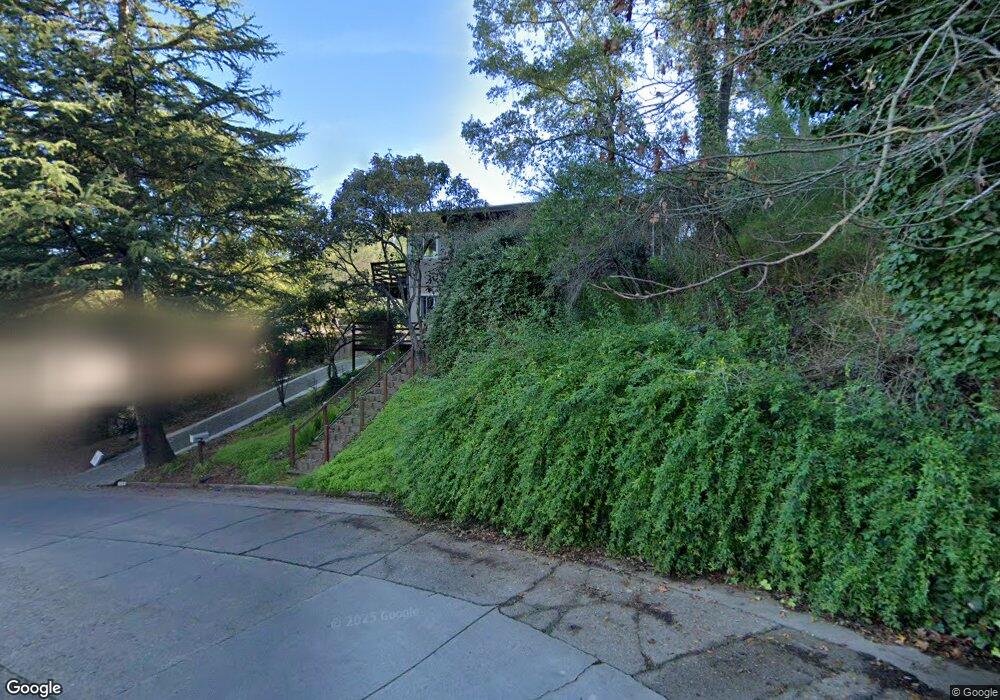
123 Bungalow Ave San Rafael, CA 94901
Picnic Valley NeighborhoodEstimated Value: $1,061,000 - $1,271,669
2
Beds
3
Baths
2,058
Sq Ft
$580/Sq Ft
Est. Value
About This Home
This home is located at 123 Bungalow Ave, San Rafael, CA 94901 and is currently estimated at $1,194,417, approximately $580 per square foot. 123 Bungalow Ave is a home located in Marin County with nearby schools including Laurel Dell Elementary School, James B. Davidson Middle School, and San Rafael High School.
Ownership History
Date
Name
Owned For
Owner Type
Purchase Details
Closed on
Aug 15, 2020
Sold by
Zaborowskl Ewa
Bought by
Zaborowskl Ewa and Ewa Zaborowskl Trust
Current Estimated Value
Purchase Details
Closed on
Sep 16, 1997
Sold by
Goodman Carol D and Ellis Barbara J
Bought by
Zaborowski Wojciech and Zaborowski Ewa
Home Financials for this Owner
Home Financials are based on the most recent Mortgage that was taken out on this home.
Original Mortgage
$240,000
Outstanding Balance
$37,423
Interest Rate
7.54%
Estimated Equity
$1,156,994
Create a Home Valuation Report for This Property
The Home Valuation Report is an in-depth analysis detailing your home's value as well as a comparison with similar homes in the area
Home Values in the Area
Average Home Value in this Area
Purchase History
| Date | Buyer | Sale Price | Title Company |
|---|---|---|---|
| Zaborowskl Ewa | -- | None Available | |
| Zaborowski Wojciech | $300,000 | California Land Title Co |
Source: Public Records
Mortgage History
| Date | Status | Borrower | Loan Amount |
|---|---|---|---|
| Open | Zaborowski Wojciech | $240,000 | |
| Closed | Zaborowski Wojciech | $30,000 |
Source: Public Records
Tax History Compared to Growth
Tax History
| Year | Tax Paid | Tax Assessment Tax Assessment Total Assessment is a certain percentage of the fair market value that is determined by local assessors to be the total taxable value of land and additions on the property. | Land | Improvement |
|---|---|---|---|---|
| 2025 | $7,702 | $478,994 | $134,536 | $344,458 |
| 2024 | $7,702 | $469,604 | $131,899 | $337,705 |
| 2023 | $7,520 | $460,397 | $129,313 | $331,084 |
| 2022 | $7,150 | $451,370 | $126,778 | $324,592 |
| 2021 | $7,035 | $442,520 | $124,292 | $318,228 |
| 2020 | $6,936 | $437,984 | $123,018 | $314,966 |
| 2019 | $6,596 | $429,398 | $120,606 | $308,792 |
| 2018 | $6,526 | $420,980 | $118,242 | $302,738 |
| 2017 | $6,295 | $412,727 | $115,924 | $296,803 |
| 2016 | $6,071 | $404,636 | $113,651 | $290,985 |
| 2015 | $5,805 | $398,558 | $111,944 | $286,614 |
| 2014 | $5,550 | $390,752 | $109,752 | $281,000 |
Source: Public Records
Map
Nearby Homes