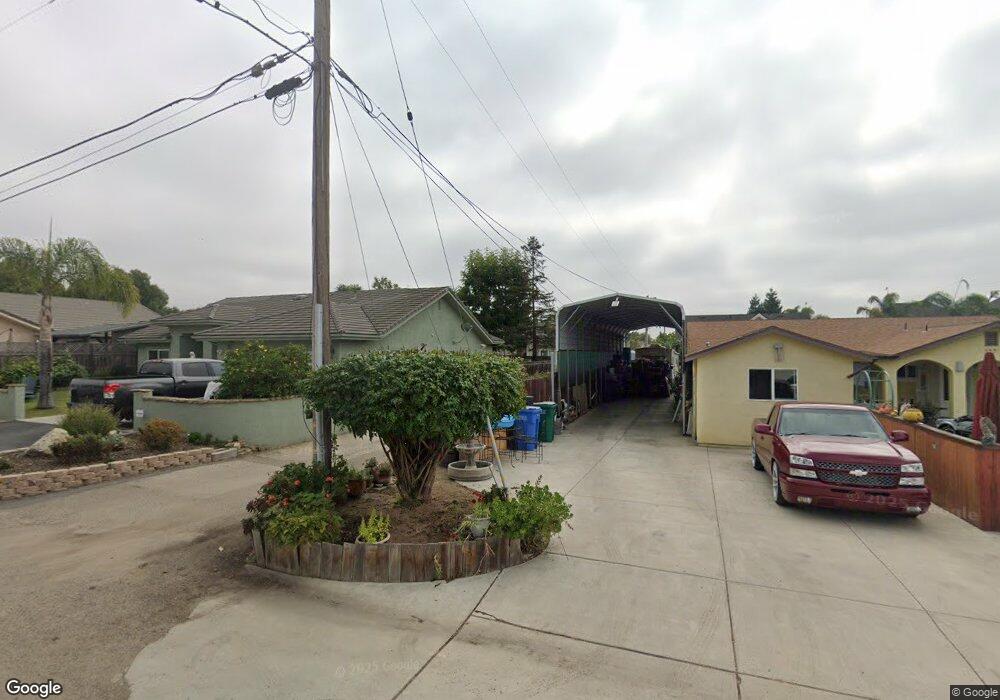
123 Day St Nipomo, CA 93444
Estimated Value: $756,119 - $838,000
3
Beds
2
Baths
1,927
Sq Ft
$415/Sq Ft
Est. Value
About This Home
This home is located at 123 Day St, Nipomo, CA 93444 and is currently estimated at $798,780, approximately $414 per square foot. 123 Day St is a home located in San Luis Obispo County with nearby schools including Nipomo Elementary School, Mesa Middle School, and Nipomo High School.
Ownership History
Date
Name
Owned For
Owner Type
Purchase Details
Closed on
Apr 22, 2018
Sold by
Montoya Michael A
Bought by
Stater Michael Christian and Stater Kathryn Elizabeth
Current Estimated Value
Home Financials for this Owner
Home Financials are based on the most recent Mortgage that was taken out on this home.
Original Mortgage
$457,460
Interest Rate
5.75%
Mortgage Type
FHA
Create a Home Valuation Report for This Property
The Home Valuation Report is an in-depth analysis detailing your home's value as well as a comparison with similar homes in the area
Home Values in the Area
Average Home Value in this Area
Purchase History
| Date | Buyer | Sale Price | Title Company |
|---|---|---|---|
| Stater Michael Christian | $466,000 | First American Title Co | |
| Montoya Michael A | -- | First American Title Co |
Source: Public Records
Mortgage History
| Date | Status | Borrower | Loan Amount |
|---|---|---|---|
| Previous Owner | Stater Michael Christian | $457,460 |
Source: Public Records
Tax History Compared to Growth
Tax History
| Year | Tax Paid | Tax Assessment Tax Assessment Total Assessment is a certain percentage of the fair market value that is determined by local assessors to be the total taxable value of land and additions on the property. | Land | Improvement |
|---|---|---|---|---|
| 2025 | $5,346 | $519,714 | $223,101 | $296,613 |
| 2024 | $5,284 | $509,525 | $218,727 | $290,798 |
| 2023 | $5,284 | $499,536 | $214,439 | $285,097 |
| 2022 | $5,205 | $489,742 | $210,235 | $279,507 |
| 2021 | $5,195 | $480,140 | $206,113 | $274,027 |
| 2020 | $5,136 | $475,218 | $204,000 | $271,218 |
| 2019 | $5,104 | $465,900 | $200,000 | $265,900 |
| 2018 | $5,918 | $536,000 | $270,000 | $266,000 |
| 2017 | $5,736 | $519,000 | $260,000 | $259,000 |
| 2016 | $4,891 | $460,000 | $230,000 | $230,000 |
| 2015 | $4,692 | $441,000 | $225,000 | $216,000 |
| 2014 | $4,493 | $430,000 | $215,000 | $215,000 |
Source: Public Records
Map
Nearby Homes
- 124 W Chestnut St
- 400 N Oakglen Ave
- 150 E Chestnut St
- 1 W Branch St
- 182 E Chestnut St
- 189 E Tefft St
- 195 E Tefft St
- 267 W Tefft St
- 285 E Tefft St
- 0 S Burton St
- 90111003 W Price St
- 100 E Bennett St
- 160 San Antonio Ln
- 449 W Tefft St
- 449 W Tefft St Unit 23
- 449 W Tefft St Unit 13
- 230 Hans Place
- 255 Encino Ln
- 205 Encino Ln
- 240 Chaparral Ln