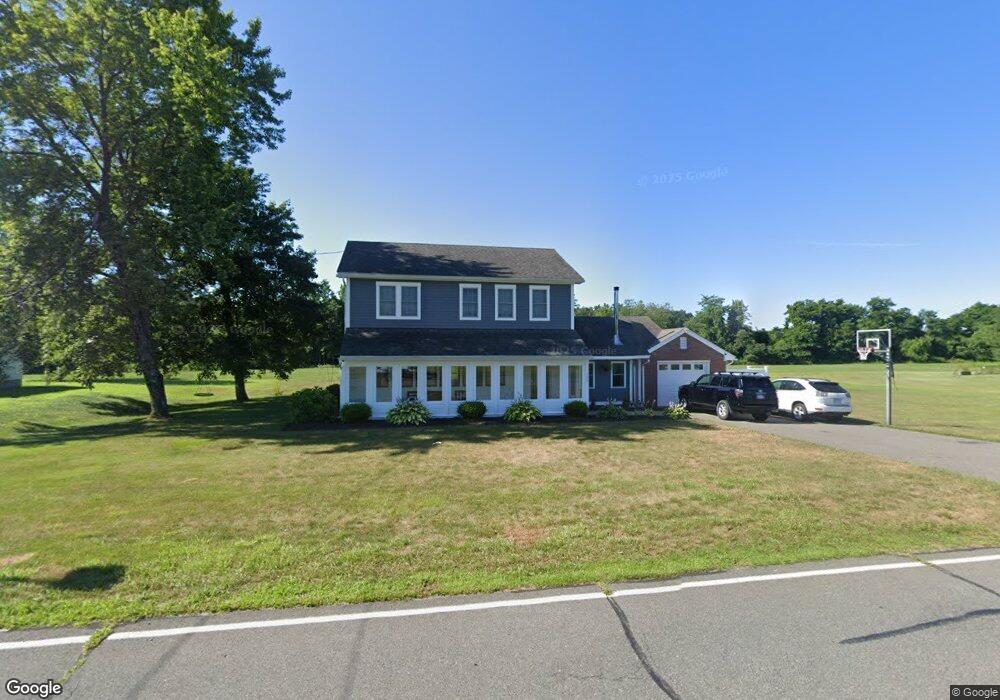
123 Depot Rd Hatfield, MA 01038
Estimated Value: $371,000 - $518,000
3
Beds
1
Bath
1,021
Sq Ft
$437/Sq Ft
Est. Value
About This Home
This home is located at 123 Depot Rd, Hatfield, MA 01038 and is currently estimated at $445,832, approximately $436 per square foot. 123 Depot Rd is a home located in Hampshire County with nearby schools including Hatfield Elementary School and Smith Academy.
Ownership History
Date
Name
Owned For
Owner Type
Purchase Details
Closed on
Jun 4, 2014
Sold by
Jagodzinski David F
Bought by
Jagodzinski David F and Jagodzinski Jill M
Current Estimated Value
Home Financials for this Owner
Home Financials are based on the most recent Mortgage that was taken out on this home.
Original Mortgage
$248,000
Outstanding Balance
$187,204
Interest Rate
4%
Mortgage Type
Adjustable Rate Mortgage/ARM
Estimated Equity
$258,628
Purchase Details
Closed on
Aug 19, 2009
Sold by
Jagodzinski David F and Jagodzinski Jill M
Bought by
Jagodzinski David F
Home Financials for this Owner
Home Financials are based on the most recent Mortgage that was taken out on this home.
Original Mortgage
$179,029
Interest Rate
5.19%
Mortgage Type
FHA
Purchase Details
Closed on
Jun 30, 2005
Sold by
De-Sanmiguel Carlos
Bought by
Jagodzinski David F and Kuchieski Jill M
Home Financials for this Owner
Home Financials are based on the most recent Mortgage that was taken out on this home.
Original Mortgage
$170,819
Interest Rate
5.73%
Mortgage Type
Purchase Money Mortgage
Purchase Details
Closed on
Apr 6, 2005
Sold by
Frizzle Donald B and Frizzle Kay B
Bought by
Frizzle Donald B and Desan-Miguel Carlos
Create a Home Valuation Report for This Property
The Home Valuation Report is an in-depth analysis detailing your home's value as well as a comparison with similar homes in the area
Home Values in the Area
Average Home Value in this Area
Purchase History
| Date | Buyer | Sale Price | Title Company |
|---|---|---|---|
| Jagodzinski David F | -- | -- | |
| Jagodzinski David F | -- | -- | |
| Jagodzinski David F | $173,500 | -- | |
| Frizzle Donald B | -- | -- |
Source: Public Records
Mortgage History
| Date | Status | Borrower | Loan Amount |
|---|---|---|---|
| Open | Jagodzinski David F | $248,000 | |
| Previous Owner | Jagodzinski David F | $179,029 | |
| Previous Owner | Jagodzinski David F | $170,819 | |
| Previous Owner | Frizzle Donald B | $30,000 |
Source: Public Records
Tax History
| Year | Tax Paid | Tax Assessment Tax Assessment Total Assessment is a certain percentage of the fair market value that is determined by local assessors to be the total taxable value of land and additions on the property. | Land | Improvement |
|---|---|---|---|---|
| 2025 | $6,168 | $445,700 | $127,200 | $318,500 |
| 2024 | $5,896 | $385,100 | $110,800 | $274,300 |
| 2023 | $4,897 | $363,300 | $105,400 | $257,900 |
| 2022 | $4,765 | $348,600 | $99,900 | $248,700 |
| 2021 | $4,556 | $321,100 | $90,800 | $230,300 |
| 2020 | $4,338 | $320,600 | $90,800 | $229,800 |
| 2019 | $4,235 | $304,900 | $89,000 | $215,900 |
| 2018 | $3,850 | $283,500 | $89,000 | $194,500 |
| 2017 | $3,630 | $274,600 | $89,000 | $185,600 |
| 2016 | $2,950 | $223,800 | $89,000 | $134,800 |
| 2015 | $2,496 | $189,500 | $79,900 | $109,600 |
| 2014 | $2,333 | $184,100 | $79,900 | $104,200 |
Source: Public Records
Map
Nearby Homes
- 151 Pantry Rd
- 59 N Hatfield Rd
- 0 Straits Rd
- 149 Prospect St
- 71 Chestnut St
- 7 Christian Ln
- 0 North St Unit 73407299
- 8 Aloha Dr
- 62 Bridge St
- 3 Frost Ln
- 58 Main St Unit 4
- 58 Main St Unit 3
- 18 Elm St
- 6 Shattuck Rd
- 15 S Plain Rd
- Lot 3 Roosevelt St
- 27 River Dr
- 0 Greenfield Rd Unit 73472322
- 32 Stonewall Dr
- 26 S Main St
Your Personal Tour Guide
Ask me questions while you tour the home.