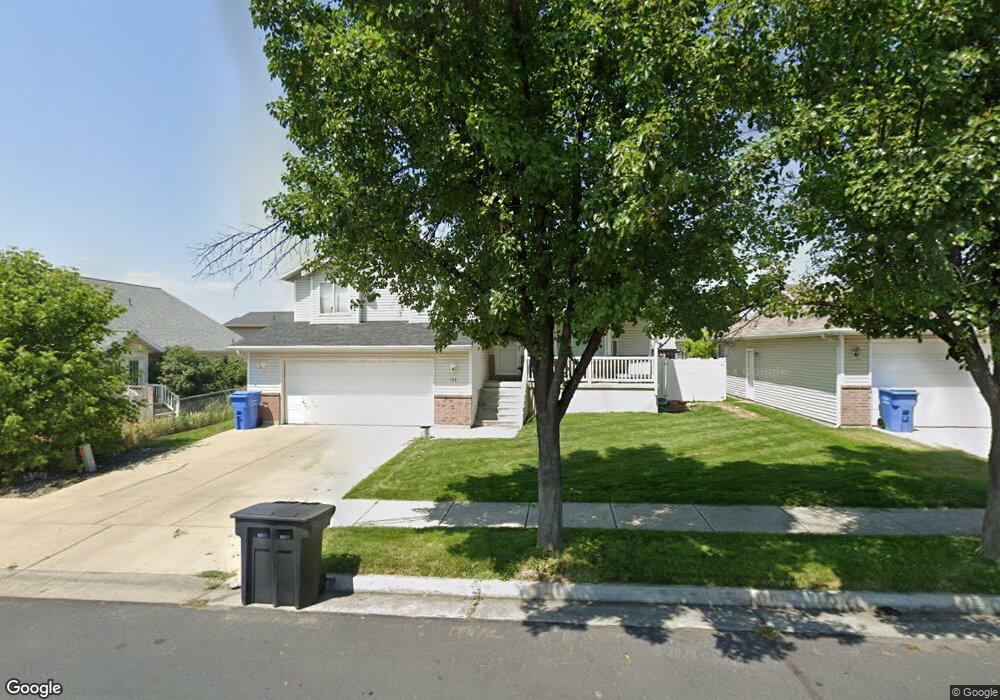
123 E 360 N Unit 39 Providence, UT 84332
Estimated Value: $468,000 - $488,000
--
Bed
--
Bath
1,549
Sq Ft
$309/Sq Ft
Est. Value
About This Home
This home is located at 123 E 360 N Unit 39, Providence, UT 84332 and is currently estimated at $478,052, approximately $308 per square foot. 123 E 360 N Unit 39 is a home located in Cache County with nearby schools including Providence School, Spring Creek Middle School, and South Cache Middle School.
Ownership History
Date
Name
Owned For
Owner Type
Purchase Details
Closed on
Jul 15, 2025
Sold by
Bankhead Jay D
Bought by
Bankhead Jay D and Nguyen Le U
Current Estimated Value
Home Financials for this Owner
Home Financials are based on the most recent Mortgage that was taken out on this home.
Original Mortgage
$700,000
Outstanding Balance
$698,824
Interest Rate
6.89%
Mortgage Type
New Conventional
Estimated Equity
-$220,772
Purchase Details
Closed on
Mar 5, 2013
Sold by
Bankhead Jay D
Bought by
Bankhead Jay D
Home Financials for this Owner
Home Financials are based on the most recent Mortgage that was taken out on this home.
Original Mortgage
$118,500
Interest Rate
3.4%
Mortgage Type
New Conventional
Purchase Details
Closed on
May 16, 2002
Sold by
H F Development Inc
Bought by
Monarch Homes Inc
Home Financials for this Owner
Home Financials are based on the most recent Mortgage that was taken out on this home.
Original Mortgage
$121,600
Interest Rate
6.94%
Create a Home Valuation Report for This Property
The Home Valuation Report is an in-depth analysis detailing your home's value as well as a comparison with similar homes in the area
Home Values in the Area
Average Home Value in this Area
Purchase History
| Date | Buyer | Sale Price | Title Company |
|---|---|---|---|
| Bankhead Jay D | -- | Hickman Land Title | |
| Bankhead Jay D | -- | Hickman Land Title Company | |
| Monarch Homes Inc | -- | Northern Title Company |
Source: Public Records
Mortgage History
| Date | Status | Borrower | Loan Amount |
|---|---|---|---|
| Open | Bankhead Jay D | $700,000 | |
| Closed | Bankhead Jay D | $100,000 | |
| Previous Owner | Bankhead Jay D | $118,500 | |
| Previous Owner | Monarch Homes Inc | $121,600 |
Source: Public Records
Tax History Compared to Growth
Tax History
| Year | Tax Paid | Tax Assessment Tax Assessment Total Assessment is a certain percentage of the fair market value that is determined by local assessors to be the total taxable value of land and additions on the property. | Land | Improvement |
|---|---|---|---|---|
| 2025 | $2,030 | $284,590 | $0 | $0 |
| 2024 | $2,169 | $282,890 | $0 | $0 |
| 2023 | $2,273 | $279,395 | $0 | $0 |
| 2022 | $2,035 | $236,195 | $0 | $0 |
| 2021 | $1,987 | $353,345 | $48,950 | $304,395 |
| 2020 | $1,615 | $266,277 | $48,950 | $217,327 |
| 2019 | $1,706 | $266,277 | $48,950 | $217,327 |
| 2018 | $1,492 | $237,930 | $48,950 | $188,980 |
| 2017 | $1,377 | $116,215 | $0 | $0 |
| 2016 | $1,392 | $116,215 | $0 | $0 |
| 2015 | $1,193 | $99,315 | $0 | $0 |
| 2014 | $1,163 | $99,315 | $0 | $0 |
| 2013 | -- | $99,315 | $0 | $0 |
Source: Public Records
Map
Nearby Homes
- 76 E Springs Ln
- 66 E Springs Ln
- 23 Andrews Ln
- 11 Mountain View Ln
- 201 E 580 N
- 216 E 610 N
- 27 W Spring Creek Pkwy
- 289 N 100 E
- 315 Mountain View Ln
- 672 N 170 E
- 175 E 550 N
- 208 E 610 N
- 374 N 100 W
- Lyndhurst Plan at Vineyard - Providence
- Fairview Plan at Vineyard - Providence
- Auburn Plan at Vineyard - Providence
- Springhill Plan at Vineyard - Providence
- Madison Plan at Vineyard - Providence
- Redwood Plan at Vineyard - Providence
- Sumac Plan at Vineyard - Providence