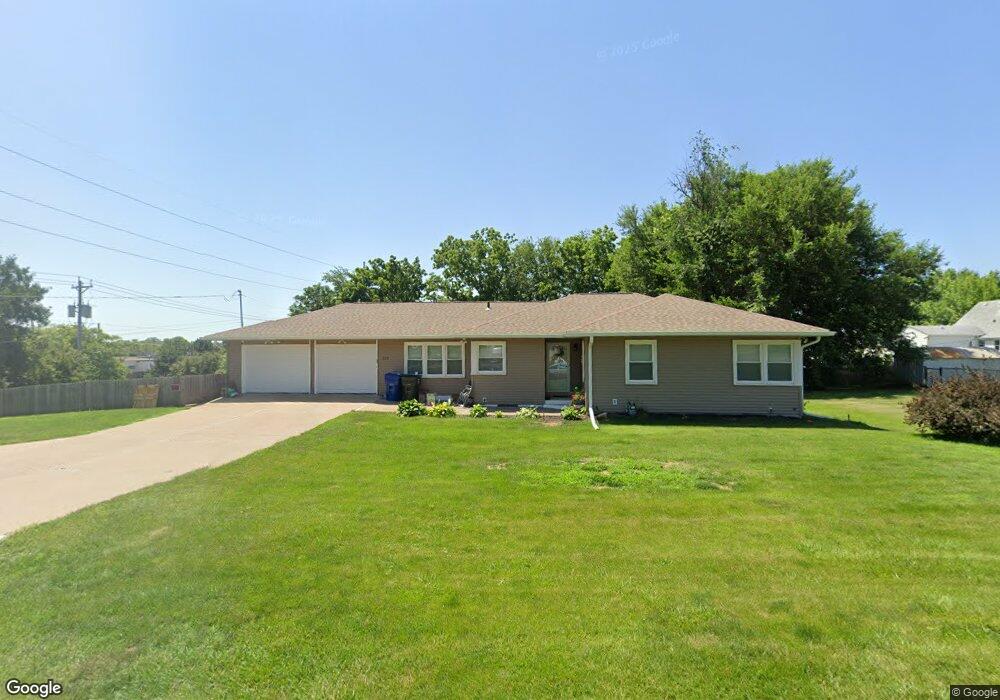
123 E 37th St Davenport, IA 52806
North Side NeighborhoodEstimated Value: $176,000 - $211,000
3
Beds
2
Baths
1,437
Sq Ft
$135/Sq Ft
Est. Value
About This Home
This home is located at 123 E 37th St, Davenport, IA 52806 and is currently estimated at $193,672, approximately $134 per square foot. 123 E 37th St is a home located in Scott County with nearby schools including Garfield Elementary School, Sudlow Intermediate School, and Central High School.
Ownership History
Date
Name
Owned For
Owner Type
Purchase Details
Closed on
Mar 5, 2021
Sold by
Vileman Joshua and Hileman Brittani
Bought by
Clauss Jonathan Charles
Current Estimated Value
Home Financials for this Owner
Home Financials are based on the most recent Mortgage that was taken out on this home.
Original Mortgage
$148,650
Outstanding Balance
$132,951
Interest Rate
2.7%
Mortgage Type
New Conventional
Estimated Equity
$60,721
Purchase Details
Closed on
Sep 25, 2015
Sold by
Clauss Dorothy M
Bought by
Hileman Brittani and Hileman Joshua A
Home Financials for this Owner
Home Financials are based on the most recent Mortgage that was taken out on this home.
Original Mortgage
$115,371
Interest Rate
4.12%
Mortgage Type
FHA
Purchase Details
Closed on
Mar 29, 2006
Sold by
Clauss Dorothy M
Bought by
Clauss Dorothy M and Clauss Jonathan C
Create a Home Valuation Report for This Property
The Home Valuation Report is an in-depth analysis detailing your home's value as well as a comparison with similar homes in the area
Home Values in the Area
Average Home Value in this Area
Purchase History
| Date | Buyer | Sale Price | Title Company |
|---|---|---|---|
| Clauss Jonathan Charles | $157,000 | None Listed On Document | |
| Hileman Brittani | $117,500 | Gomez Title | |
| Clauss Dorothy M | -- | None Available |
Source: Public Records
Mortgage History
| Date | Status | Borrower | Loan Amount |
|---|---|---|---|
| Open | Clauss Jonathan Charles | $148,650 | |
| Previous Owner | Hileman Brittani | $115,371 |
Source: Public Records
Tax History Compared to Growth
Tax History
| Year | Tax Paid | Tax Assessment Tax Assessment Total Assessment is a certain percentage of the fair market value that is determined by local assessors to be the total taxable value of land and additions on the property. | Land | Improvement |
|---|---|---|---|---|
| 2025 | $2,810 | $185,410 | $47,500 | $137,910 |
| 2024 | $2,858 | $167,500 | $47,500 | $120,000 |
| 2023 | $2,952 | $167,500 | $47,500 | $120,000 |
| 2022 | $2,956 | $147,080 | $44,110 | $102,970 |
| 2021 | $2,956 | $146,730 | $44,110 | $102,620 |
| 2020 | $2,964 | $136,470 | $44,110 | $92,360 |
| 2019 | $3,062 | $136,470 | $44,110 | $92,360 |
| 2018 | $2,884 | $136,470 | $44,110 | $92,360 |
| 2017 | $2,986 | $131,340 | $44,110 | $87,230 |
| 2016 | $2,682 | $122,490 | $0 | $0 |
| 2015 | $2,682 | $129,850 | $0 | $0 |
| 2014 | $2,884 | $129,850 | $0 | $0 |
| 2013 | $2,834 | $0 | $0 | $0 |
| 2012 | -- | $141,230 | $70,800 | $70,430 |
Source: Public Records
Map
Nearby Homes
- 3546 Fair Ave
- 235 W 32nd St
- 2927 Fair Ave
- 2946 Iowa St
- 3026 Jefferson Ave
- 405 W 30th St
- 2813 N Main St
- 2811 N Brady St
- 3248 Valle Vista Rd
- 2723 Pershing Ave
- 2721 N Harrison St
- 2660 Dubuque St
- 2709 Iowa St
- 320 W Hayes St Unit 320, 320 1/2, 320 1/
- 3567 Kimberly Downs Rd
- 3553 Kimberly Downs Rd
- 510 W Garfield St
- 2761 Scott St
- 405 Westerfield Rd
- 2830 Western Ave