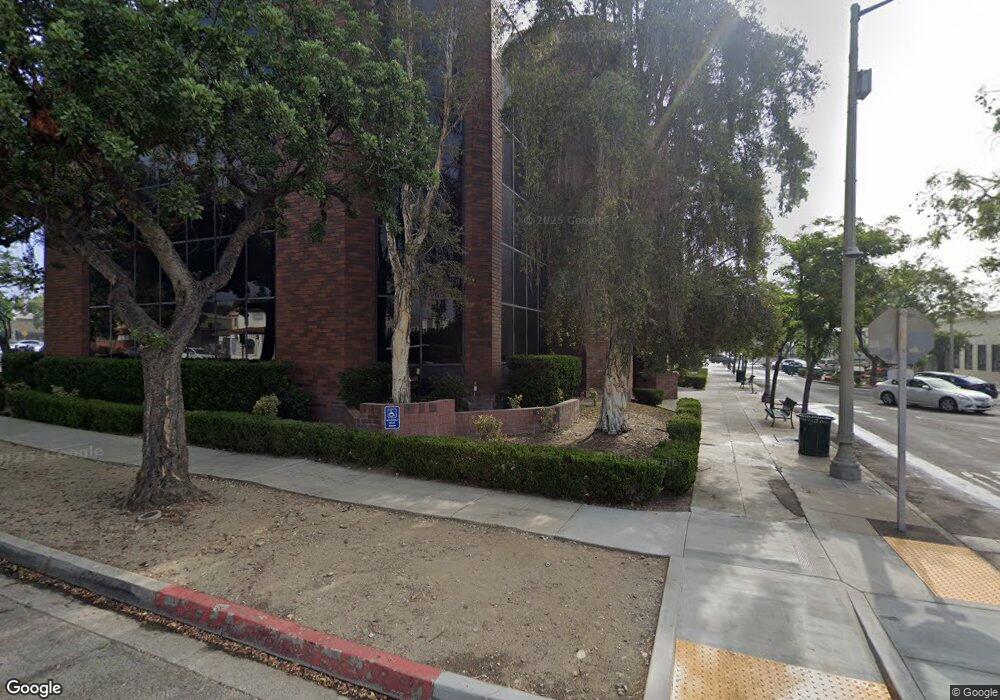
123 E 9th St Unit 101 Upland, CA 91786
Estimated Value: $5,684,346
Studio
--
Bath
24,046
Sq Ft
$236/Sq Ft
Est. Value
About This Home
This home is located at 123 E 9th St Unit 101, Upland, CA 91786 and is currently estimated at $5,684,346, approximately $236 per square foot. 123 E 9th St Unit 101 is a home located in San Bernardino County with nearby schools including Upland Elementary School, Upland Junior High School, and Upland High School.
Ownership History
Date
Name
Owned For
Owner Type
Purchase Details
Closed on
Oct 15, 2014
Sold by
Huntco Industries Llc
Bought by
Upland Inn Llc
Current Estimated Value
Home Financials for this Owner
Home Financials are based on the most recent Mortgage that was taken out on this home.
Original Mortgage
$1,798,100
Outstanding Balance
$1,378,505
Interest Rate
4.1%
Mortgage Type
Commercial
Estimated Equity
$4,305,841
Purchase Details
Closed on
Mar 13, 1997
Sold by
Sowamco X
Bought by
Huntco Industries Llc
Home Financials for this Owner
Home Financials are based on the most recent Mortgage that was taken out on this home.
Original Mortgage
$807,500
Interest Rate
7.63%
Mortgage Type
Seller Take Back
Purchase Details
Closed on
May 4, 1995
Sold by
Ninth Street Investors
Bought by
Sowamco X Ltd
Create a Home Valuation Report for This Property
The Home Valuation Report is an in-depth analysis detailing your home's value as well as a comparison with similar homes in the area
Home Values in the Area
Average Home Value in this Area
Purchase History
| Date | Buyer | Sale Price | Title Company |
|---|---|---|---|
| Upland Inn Llc | $2,675,000 | Spl Title Services | |
| Huntco Industries Llc | $950,000 | Orange Coast Title | |
| Sowamco X Ltd | $1,060,000 | World Title Company |
Source: Public Records
Mortgage History
| Date | Status | Borrower | Loan Amount |
|---|---|---|---|
| Open | Upland Inn Llc | $1,798,100 | |
| Previous Owner | Huntco Industries Llc | $807,500 |
Source: Public Records
Tax History
| Year | Tax Paid | Tax Assessment Tax Assessment Total Assessment is a certain percentage of the fair market value that is determined by local assessors to be the total taxable value of land and additions on the property. | Land | Improvement |
|---|---|---|---|---|
| 2025 | $34,737 | $3,214,951 | $221,141 | $2,993,810 |
| 2024 | $33,632 | $3,151,913 | $216,805 | $2,935,108 |
| 2023 | $33,141 | $3,090,111 | $212,554 | $2,877,557 |
| 2022 | $32,435 | $3,029,520 | $208,386 | $2,821,134 |
| 2021 | $32,423 | $2,970,118 | $204,300 | $2,765,818 |
| 2020 | $31,544 | $2,939,663 | $202,205 | $2,737,458 |
| 2019 | $31,434 | $2,882,022 | $198,240 | $2,683,782 |
| 2018 | $30,649 | $2,825,512 | $194,353 | $2,631,159 |
| 2017 | $29,766 | $2,770,110 | $190,542 | $2,579,568 |
| 2016 | $29,234 | $2,715,794 | $186,806 | $2,528,988 |
| 2015 | $13,758 | $1,287,380 | $166,682 | $1,120,698 |
| 2014 | $13,404 | $1,262,162 | $163,417 | $1,098,745 |
Source: Public Records
Map
Nearby Homes
Your Personal Tour Guide
Ask me questions while you tour the home.