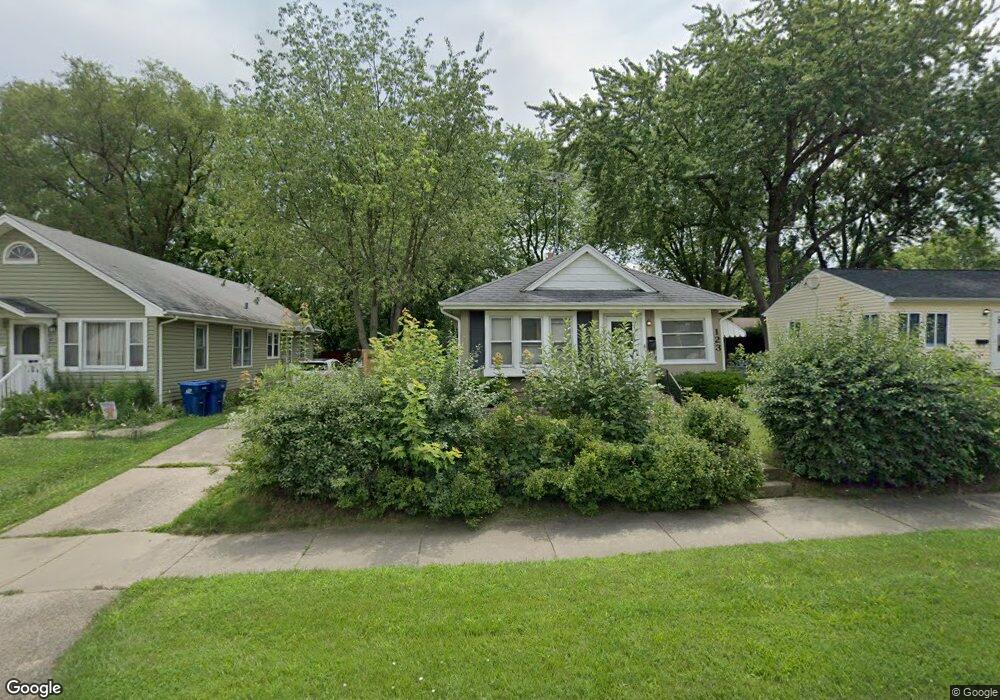
123 E Keith Ave Waukegan, IL 60085
Estimated Value: $87,000 - $244,000
3
Beds
1
Bath
925
Sq Ft
$191/Sq Ft
Est. Value
About This Home
This home is located at 123 E Keith Ave, Waukegan, IL 60085 and is currently estimated at $176,667, approximately $190 per square foot. 123 E Keith Ave is a home located in Lake County with nearby schools including Greenwood Elementary School, Edith M Smith Middle School, and Waukegan High School.
Ownership History
Date
Name
Owned For
Owner Type
Purchase Details
Closed on
Dec 30, 2024
Sold by
Bright Side Homes Llc
Bought by
Elite Equity Estates 1 Llc
Current Estimated Value
Purchase Details
Closed on
Oct 17, 2024
Sold by
Hedderly William L and St Jean Shelley A
Bought by
Bright Side Homes Llc
Purchase Details
Closed on
Nov 9, 1995
Sold by
Elie Edward J
Bought by
Hedderly William L and Hedderly Betty E
Home Financials for this Owner
Home Financials are based on the most recent Mortgage that was taken out on this home.
Original Mortgage
$70,000
Interest Rate
7.65%
Create a Home Valuation Report for This Property
The Home Valuation Report is an in-depth analysis detailing your home's value as well as a comparison with similar homes in the area
Home Values in the Area
Average Home Value in this Area
Purchase History
| Date | Buyer | Sale Price | Title Company |
|---|---|---|---|
| Elite Equity Estates 1 Llc | $80,000 | None Listed On Document | |
| Bright Side Homes Llc | $54,000 | None Listed On Document | |
| Bright Side Homes Llc | $54,000 | None Listed On Document | |
| Hedderly William L | $87,500 | Ticor Title Insurance Compan |
Source: Public Records
Mortgage History
| Date | Status | Borrower | Loan Amount |
|---|---|---|---|
| Previous Owner | Hedderly William L | $67,000 | |
| Previous Owner | Hedderly William L | $100,000 | |
| Previous Owner | Hedderly William L | $40,000 | |
| Previous Owner | Hedderly William L | $70,000 |
Source: Public Records
Tax History Compared to Growth
Tax History
| Year | Tax Paid | Tax Assessment Tax Assessment Total Assessment is a certain percentage of the fair market value that is determined by local assessors to be the total taxable value of land and additions on the property. | Land | Improvement |
|---|---|---|---|---|
| 2024 | $2,853 | $52,140 | $9,869 | $42,271 |
| 2023 | $2,853 | $46,260 | $8,756 | $37,504 |
| 2022 | $2,447 | $36,034 | $6,801 | $29,233 |
| 2021 | $2,084 | $30,985 | $5,851 | $25,134 |
| 2020 | $525 | $28,866 | $5,451 | $23,415 |
| 2019 | $569 | $26,451 | $4,995 | $21,456 |
| 2018 | $615 | $22,719 | $7,070 | $15,649 |
| 2017 | $659 | $20,100 | $6,255 | $13,845 |
| 2016 | $716 | $17,466 | $5,435 | $12,031 |
| 2015 | $782 | $15,632 | $4,864 | $10,768 |
| 2014 | $1,538 | $19,246 | $5,111 | $14,135 |
| 2012 | $2,282 | $20,852 | $5,538 | $15,314 |
Source: Public Records
Map
Nearby Homes
- 616 W Keith Ave
- 1336 N Ash St
- 1335 Chestnut St
- 415 W Ridgeland Ave
- 1110 N Ash St
- 2213 Alta Vista Dr
- 1018 W Atlantic Ave
- 2246 Alta Vista Dr
- 1905 Linden Ave
- 918 N Ash St
- 723 N County St
- 1312 N Linden Ave
- 1105 Woodlawn Cir
- 325 4th St
- 611 N Genesee St
- 2232 Walnut St
- 917 N Linden Ave
- 301 W Eagle Ct
- 620 N Poplar St
- 1000 Pine St
- 119 E Keith Ave
- 127 E Keith Ave
- 115 E Keith Ave
- 131 E Keith Ave
- 130 Harding Ave
- 124 Harding Ave
- 128 Harding Ave
- 111 E Keith Ave
- 120 Harding Ave
- 124 E Keith Ave
- 105 E Keith Ave
- 203 E Keith Ave
- 126 E Keith Ave
- 120 E Keith Ave
- 116 Harding Ave
- 116 E Keith Ave
- 132 E Keith Ave
- 205 E Keith Ave
- 103 E Keith Ave
- 112 E Keith Ave