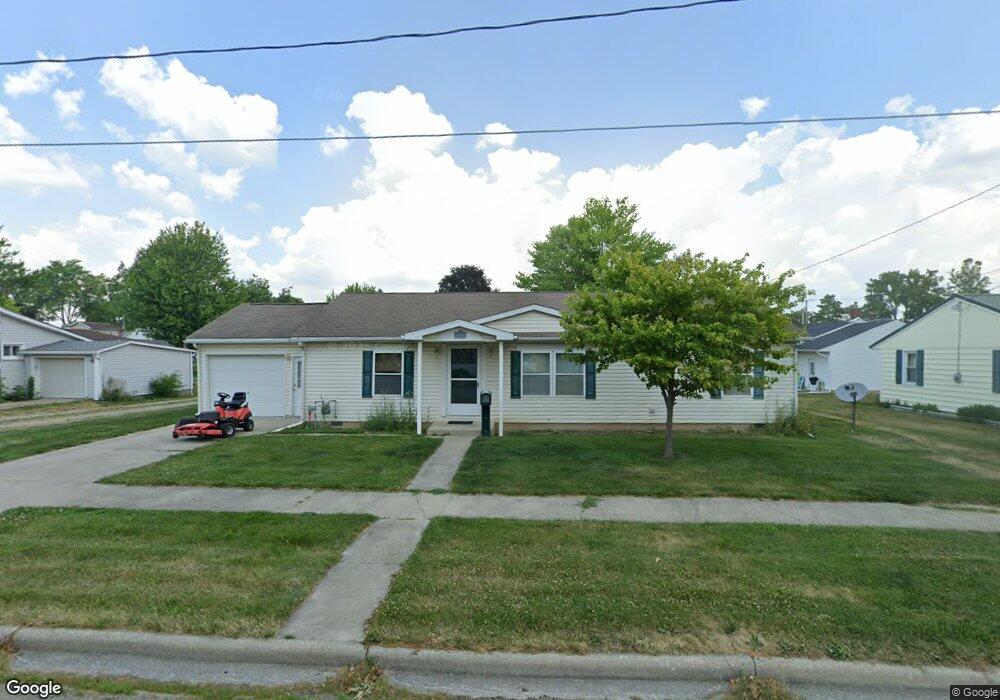
123 E Willow St Wauseon, OH 43567
Estimated Value: $151,000 - $174,000
3
Beds
2
Baths
1,388
Sq Ft
$119/Sq Ft
Est. Value
About This Home
This home is located at 123 E Willow St, Wauseon, OH 43567 and is currently estimated at $164,788, approximately $118 per square foot. 123 E Willow St is a home located in Fulton County with nearby schools including Wauseon Primary School, Wauseon Elementary School, and Wauseon Middle School.
Ownership History
Date
Name
Owned For
Owner Type
Purchase Details
Closed on
Nov 21, 2023
Sold by
Lane Janie L and Lane Todd A
Bought by
Lane Wyatt L and Brackman Jayla
Current Estimated Value
Home Financials for this Owner
Home Financials are based on the most recent Mortgage that was taken out on this home.
Original Mortgage
$132,300
Outstanding Balance
$130,023
Interest Rate
7.57%
Mortgage Type
New Conventional
Estimated Equity
$34,765
Purchase Details
Closed on
Jul 16, 2012
Sold by
Sams Nancy Jo and Sams Merrill G
Bought by
Lane Janie L
Purchase Details
Closed on
Apr 17, 2002
Sold by
O'Brien Russell
Bought by
Wyatt Suzanne M
Home Financials for this Owner
Home Financials are based on the most recent Mortgage that was taken out on this home.
Original Mortgage
$44,000
Interest Rate
6.93%
Mortgage Type
New Conventional
Purchase Details
Closed on
Jan 1, 1990
Bought by
B & J Enterprises A
Create a Home Valuation Report for This Property
The Home Valuation Report is an in-depth analysis detailing your home's value as well as a comparison with similar homes in the area
Home Values in the Area
Average Home Value in this Area
Purchase History
| Date | Buyer | Sale Price | Title Company |
|---|---|---|---|
| Lane Wyatt L | $147,000 | None Listed On Document | |
| Lane Janie L | $40,000 | Attorney | |
| Wyatt Suzanne M | $104,000 | -- | |
| B & J Enterprises A | -- | -- |
Source: Public Records
Mortgage History
| Date | Status | Borrower | Loan Amount |
|---|---|---|---|
| Open | Lane Wyatt L | $132,300 | |
| Previous Owner | Wyatt Suzanne M | $44,000 |
Source: Public Records
Tax History
| Year | Tax Paid | Tax Assessment Tax Assessment Total Assessment is a certain percentage of the fair market value that is determined by local assessors to be the total taxable value of land and additions on the property. | Land | Improvement |
|---|---|---|---|---|
| 2024 | $2,411 | $49,000 | $6,650 | $42,350 |
| 2023 | $2,489 | $49,000 | $6,650 | $42,350 |
| 2022 | $2,206 | $36,890 | $5,530 | $31,360 |
| 2021 | $2,384 | $36,890 | $5,530 | $31,360 |
| 2020 | $2,167 | $36,890 | $5,530 | $31,360 |
| 2019 | $2,133 | $35,770 | $5,530 | $30,240 |
| 2018 | $1,869 | $35,770 | $5,530 | $30,240 |
| 2017 | $1,843 | $35,770 | $5,530 | $30,240 |
| 2016 | $1,785 | $30,800 | $5,530 | $25,270 |
| 2015 | $1,677 | $30,800 | $5,530 | $25,270 |
| 2014 | $1,595 | $30,800 | $5,530 | $25,270 |
| 2013 | $1,558 | $27,800 | $4,730 | $23,070 |
Source: Public Records
Map
Nearby Homes
- 833 3rd St
- 351 E Walnut St
- 203 E Oak St
- 234 W Chestnut St
- 252 W Chestnut St
- 263 W Chestnut St
- 239 W Chestnut St
- 1338 N Park Ln
- 840 Pine St
- 594 Douglas Dr
- 622 Vine St
- 420 Clover Ln
- 460 Airport Hwy
- 14578 Us Highway 20a
- 1066 Seneca Dr
- 1062 Seneca Dr
- 1171 Apache Dr
- Integrity 1830 Plan at Arrowhead Trails
- Integrity 2080 Plan at Arrowhead Trails
- 760 Airport Hwy
Your Personal Tour Guide
Ask me questions while you tour the home.