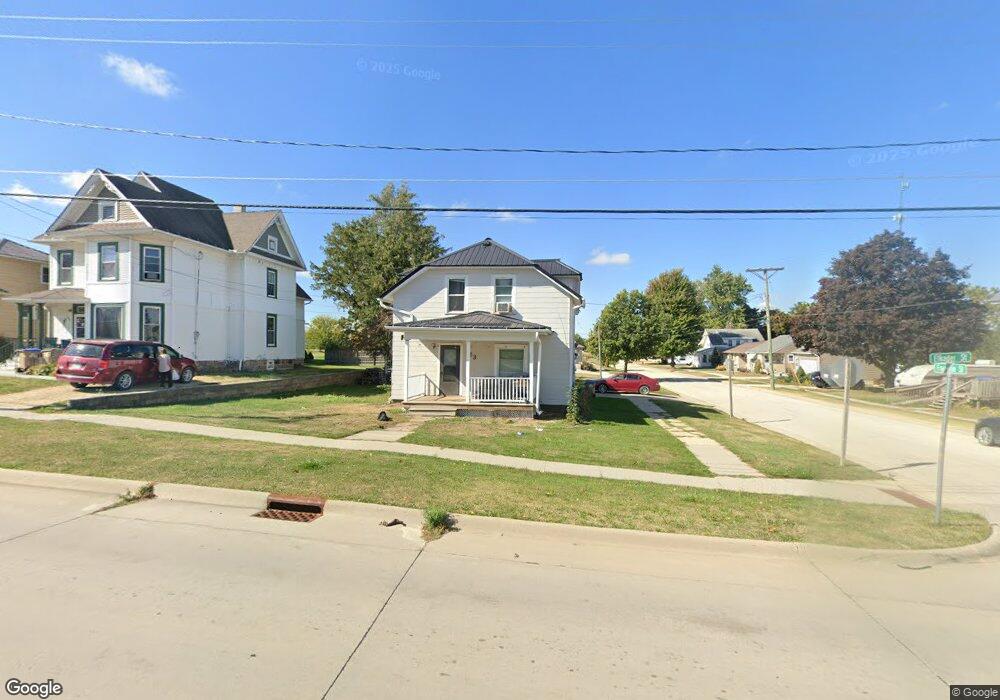
123 Elkader St Strawberry Point, IA 52076
Estimated Value: $100,000 - $136,000
3
Beds
1
Bath
1,326
Sq Ft
$90/Sq Ft
Est. Value
About This Home
This home is located at 123 Elkader St, Strawberry Point, IA 52076 and is currently estimated at $119,148, approximately $89 per square foot. 123 Elkader St is a home located in Clayton County with nearby schools including Starmont Elementary School, Starmont Middle School, and Starmont High School.
Ownership History
Date
Name
Owned For
Owner Type
Purchase Details
Closed on
Aug 24, 2017
Sold by
Willie Randy D and Willie Kimberly D
Bought by
Sanders Scotty
Current Estimated Value
Home Financials for this Owner
Home Financials are based on the most recent Mortgage that was taken out on this home.
Original Mortgage
$75,000
Outstanding Balance
$62,364
Interest Rate
3.92%
Mortgage Type
New Conventional
Estimated Equity
$56,784
Purchase Details
Closed on
May 10, 2012
Sold by
The Secretary Of Hud
Bought by
Southern Specialty Properties Llc
Purchase Details
Closed on
Nov 2, 2007
Sold by
Kuempel Marc A
Bought by
Settle Jason T
Home Financials for this Owner
Home Financials are based on the most recent Mortgage that was taken out on this home.
Original Mortgage
$55,774
Interest Rate
6.31%
Mortgage Type
FHA
Create a Home Valuation Report for This Property
The Home Valuation Report is an in-depth analysis detailing your home's value as well as a comparison with similar homes in the area
Home Values in the Area
Average Home Value in this Area
Purchase History
| Date | Buyer | Sale Price | Title Company |
|---|---|---|---|
| Sanders Scotty | -- | None Available | |
| Southern Specialty Properties Llc | -- | None Available | |
| Settle Jason T | $57,000 | None Available |
Source: Public Records
Mortgage History
| Date | Status | Borrower | Loan Amount |
|---|---|---|---|
| Open | Sanders Scotty | $75,000 | |
| Previous Owner | Settle Jason T | $55,774 |
Source: Public Records
Tax History Compared to Growth
Tax History
| Year | Tax Paid | Tax Assessment Tax Assessment Total Assessment is a certain percentage of the fair market value that is determined by local assessors to be the total taxable value of land and additions on the property. | Land | Improvement |
|---|---|---|---|---|
| 2025 | $1,416 | $94,940 | $9,317 | $85,623 |
| 2024 | $1,328 | $79,606 | $8,102 | $71,504 |
| 2023 | $1,266 | $79,606 | $8,102 | $71,504 |
| 2022 | $1,178 | $63,942 | $7,339 | $56,603 |
| 2021 | $1,857 | $63,942 | $7,339 | $56,603 |
| 2020 | $1,192 | $61,740 | $7,339 | $54,401 |
| 2019 | $1,847 | $61,740 | $7,339 | $54,401 |
| 2018 | $2,364 | $58,632 | $7,339 | $51,293 |
| 2017 | $792 | $41,242 | $7,339 | $33,903 |
| 2015 | $630 | $38,495 | $5,850 | $32,645 |
| 2014 | $825 | $38,495 | $5,850 | $32,645 |
Source: Public Records
Map
Nearby Homes
- 206 E Mission St
- 208 W Spring St
- 210 Park Ave
- 210 Commercial St
- TBD Prospect St
- 411 Westwood Ave
- 36654 Belgian Rd
- 3452 B Ave
- 1163 Iowa 13
- 407 W Newton St
- 306 & 400 N Chestnut St
- 209 Woods Edge Dr
- 108 S Center St
- 305 Peterson St
- 302 E Harrison St
- TBD Birch Rd
- 1639 165th St
- 10766 Bush Rd
- 1673 Firefly Rd
- 1729 162nd Ave
- 121 Elkader St
- 201 Elkader St
- 119 Elkader St
- 104 Franklin St
- 128 Elkader St
- 117 Elkader St
- 203 Elkader St
- 103 Franklin St
- 106 Franklin St
- 204 Elkader St
- 122 Elkader St
- 105 Franklin St
- 124 Elkader St
- 108 Franklin St
- 120 Elkader St
- 107 Franklin St
- 212 Elkader St
- 213 Elkader St
- 109 Elkader St
- 214 Elkader St