123 Elm St Martin, TN 38237
Estimated Value: $184,000 - $202,606
--
Bed
4
Baths
2,074
Sq Ft
$92/Sq Ft
Est. Value
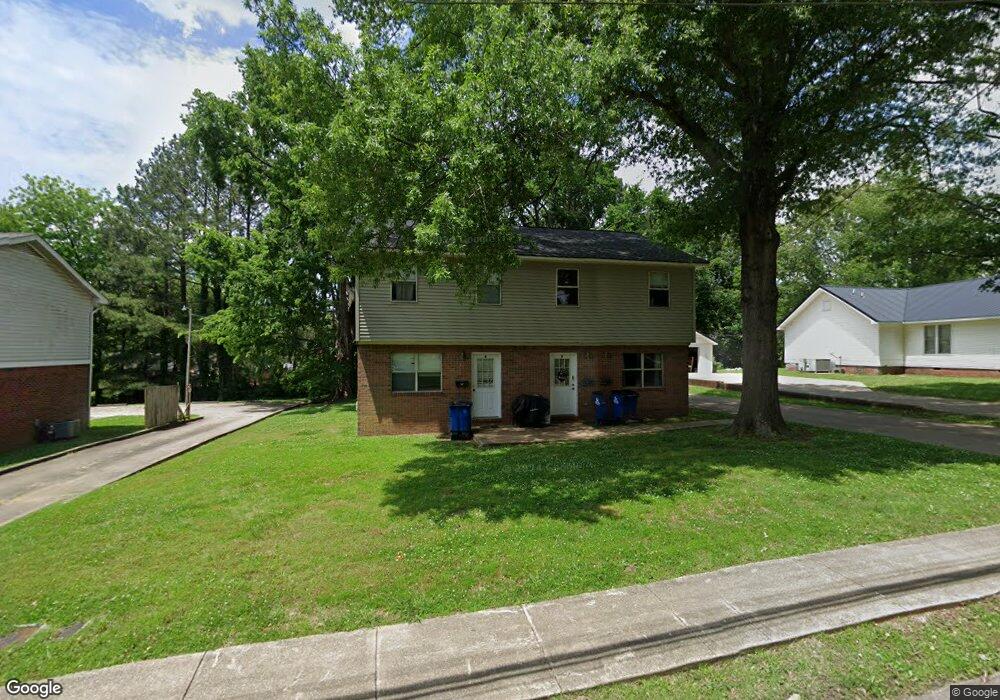
About This Home
This home is located at 123 Elm St, Martin, TN 38237 and is currently estimated at $190,902, approximately $92 per square foot. 123 Elm St is a home located in Weakley County with nearby schools including Central Christian Academy and Unity Christian School.
Ownership History
Date
Name
Owned For
Owner Type
Purchase Details
Closed on
Jan 29, 2018
Sold by
Jones Mikel L and Jones Mikel
Bought by
Jones Tresa A and Jones Tresa
Current Estimated Value
Purchase Details
Closed on
Oct 31, 2001
Sold by
Skyhawk Enterprises
Bought by
Jones Mikel L
Purchase Details
Closed on
Sep 11, 1995
Bought by
Moore Jackie And D/B/A Skyhawk Ent
Purchase Details
Closed on
Dec 22, 1994
Sold by
Mod Dev
Bought by
Modern Development Corp
Purchase Details
Closed on
Oct 31, 1994
Sold by
Fuller
Bought by
Mod Dev
Purchase Details
Closed on
Aug 25, 1994
Bought by
Fuller T R And Christopher D/B/A Fuller Partn
Create a Home Valuation Report for This Property
The Home Valuation Report is an in-depth analysis detailing your home's value as well as a comparison with similar homes in the area
Home Values in the Area
Average Home Value in this Area
Purchase History
| Date | Buyer | Sale Price | Title Company |
|---|---|---|---|
| Jones Tresa A | -- | None Available | |
| Jones Mikel L | $80,000 | -- | |
| Moore Jackie And D/B/A Skyhawk Ent | $80,000 | -- | |
| Modern Development Corp | $12,500 | -- | |
| Mod Dev | $12,500 | -- | |
| Fuller T R And Christopher D/B/A Fuller Partn | $12,500 | -- |
Source: Public Records
Tax History Compared to Growth
Tax History
| Year | Tax Paid | Tax Assessment Tax Assessment Total Assessment is a certain percentage of the fair market value that is determined by local assessors to be the total taxable value of land and additions on the property. | Land | Improvement |
|---|---|---|---|---|
| 2024 | -- | $60,240 | $8,160 | $52,080 |
| 2023 | $1,986 | $60,240 | $8,160 | $52,080 |
| 2022 | $1,662 | $44,600 | $4,800 | $39,800 |
| 2021 | $1,662 | $44,600 | $4,800 | $39,800 |
| 2020 | $1,662 | $44,600 | $4,800 | $39,800 |
| 2019 | $1,506 | $44,600 | $4,800 | $39,800 |
| 2018 | $1,506 | $44,600 | $4,800 | $39,800 |
| 2017 | $1,272 | $35,040 | $4,000 | $31,040 |
| 2016 | $1,272 | $35,040 | $0 | $0 |
| 2015 | $1,272 | $35,023 | $0 | $0 |
| 2014 | $1,272 | $35,023 | $0 | $0 |
Source: Public Records
Map
Nearby Homes