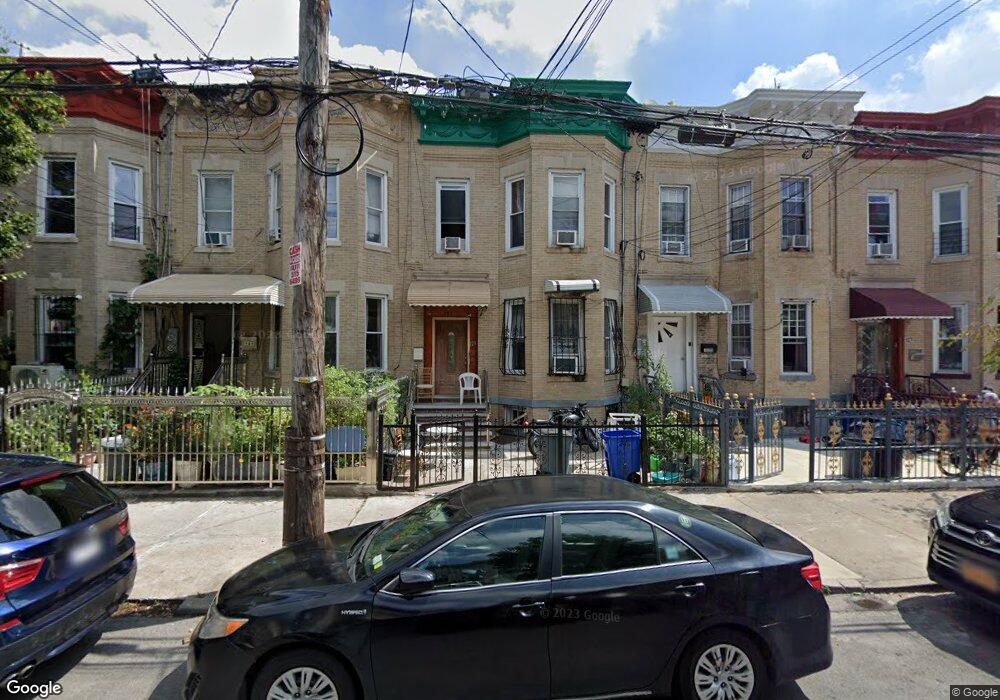
123 Forbell St Brooklyn, NY 11208
East New York NeighborhoodEstimated Value: $744,704 - $994,000
--
Bed
--
Bath
2,024
Sq Ft
$448/Sq Ft
Est. Value
About This Home
This home is located at 123 Forbell St, Brooklyn, NY 11208 and is currently estimated at $907,426, approximately $448 per square foot. 123 Forbell St is a home located in Kings County with nearby schools including P.S. 214 - Michael Friedsam, Cypress Hills Ascend Charter Lower School, and Brooklyn Scholars Charter School.
Ownership History
Date
Name
Owned For
Owner Type
Purchase Details
Closed on
Feb 2, 2021
Sold by
Rahman Asia U
Bought by
Rahman Shahida and Uddin Md J
Current Estimated Value
Home Financials for this Owner
Home Financials are based on the most recent Mortgage that was taken out on this home.
Original Mortgage
$300,000
Outstanding Balance
$268,317
Interest Rate
2.7%
Mortgage Type
Purchase Money Mortgage
Estimated Equity
$639,109
Purchase Details
Closed on
Feb 8, 2019
Sold by
Rahman Mohammed J
Bought by
Rahman Asia U
Create a Home Valuation Report for This Property
The Home Valuation Report is an in-depth analysis detailing your home's value as well as a comparison with similar homes in the area
Home Values in the Area
Average Home Value in this Area
Purchase History
| Date | Buyer | Sale Price | Title Company |
|---|---|---|---|
| Rahman Shahida | $450,000 | -- | |
| Rahman Asia U | -- | -- |
Source: Public Records
Mortgage History
| Date | Status | Borrower | Loan Amount |
|---|---|---|---|
| Open | Rahman Shahida | $300,000 |
Source: Public Records
Tax History Compared to Growth
Tax History
| Year | Tax Paid | Tax Assessment Tax Assessment Total Assessment is a certain percentage of the fair market value that is determined by local assessors to be the total taxable value of land and additions on the property. | Land | Improvement |
|---|---|---|---|---|
| 2025 | $6,560 | $52,860 | $15,360 | $37,500 |
| 2024 | $6,560 | $51,360 | $15,360 | $36,000 |
| 2023 | $6,563 | $55,560 | $15,360 | $40,200 |
| 2022 | $6,313 | $47,700 | $15,360 | $32,340 |
| 2021 | $6,435 | $40,320 | $15,360 | $24,960 |
| 2020 | $4,545 | $39,600 | $15,360 | $24,240 |
| 2019 | $5,693 | $39,600 | $15,360 | $24,240 |
| 2018 | $4,830 | $26,928 | $10,589 | $16,339 |
| 2017 | $4,726 | $26,352 | $11,187 | $15,165 |
| 2016 | $4,473 | $25,482 | $12,125 | $13,357 |
| 2015 | $2,560 | $24,040 | $15,038 | $9,002 |
| 2014 | $2,560 | $22,680 | $17,040 | $5,640 |
Source: Public Records
Map
Nearby Homes