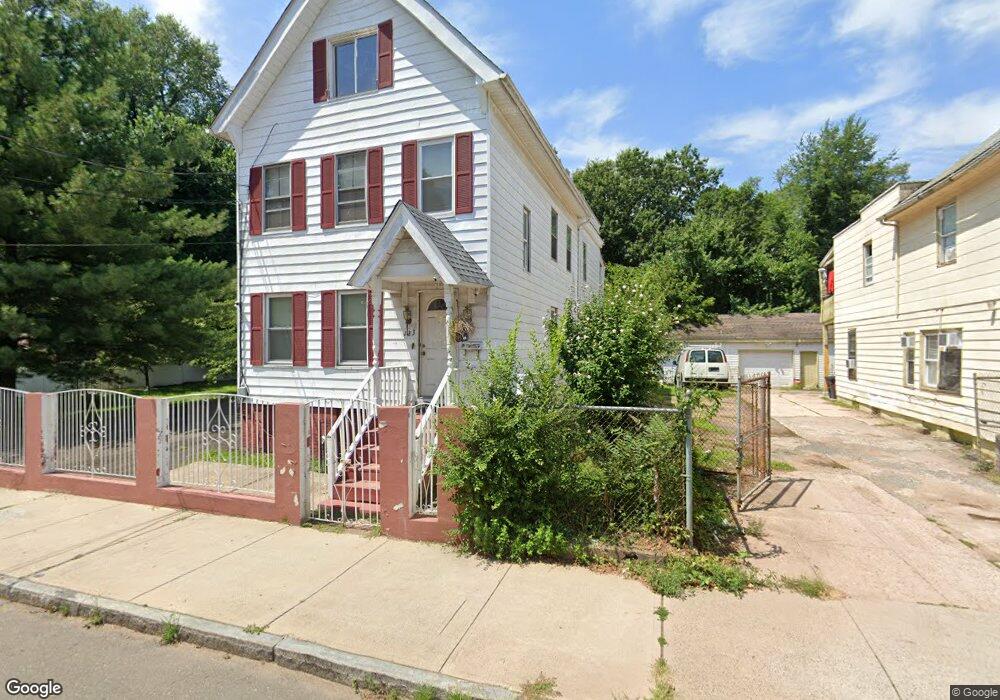
123 Frank St New Haven, CT 06519
The Hill NeighborhoodEstimated Value: $332,344 - $444,000
4
Beds
3
Baths
2,570
Sq Ft
$144/Sq Ft
Est. Value
About This Home
This home is located at 123 Frank St, New Haven, CT 06519 and is currently estimated at $370,336, approximately $144 per square foot. 123 Frank St is a home located in New Haven County with nearby schools including St Martin De Porres Academy.
Ownership History
Date
Name
Owned For
Owner Type
Purchase Details
Closed on
Feb 6, 2024
Sold by
Reyes Samuel and Reyes Maria E
Bought by
Reyes Samuel and Reyes Maria E
Current Estimated Value
Purchase Details
Closed on
Aug 31, 2021
Sold by
Cusanelli Gabriel H
Bought by
Reyes Samuel and Reyes Maria E
Purchase Details
Closed on
Aug 3, 1981
Bought by
Reyes Samuel and Reyes Maria E
Create a Home Valuation Report for This Property
The Home Valuation Report is an in-depth analysis detailing your home's value as well as a comparison with similar homes in the area
Home Values in the Area
Average Home Value in this Area
Purchase History
| Date | Buyer | Sale Price | Title Company |
|---|---|---|---|
| Reyes Samuel | -- | None Available | |
| Reyes Samuel | -- | None Available | |
| Reyes Samuel | -- | None Available | |
| Reyes Samuel | -- | None Available | |
| Cusanelli Gabriel H | -- | None Available | |
| Cusanelli Gabriel H | -- | None Available | |
| Reyes Samuel | -- | -- |
Source: Public Records
Mortgage History
| Date | Status | Borrower | Loan Amount |
|---|---|---|---|
| Previous Owner | Reyes Samuel | $25,000 | |
| Previous Owner | Reyes Samuel | $173,000 | |
| Previous Owner | Reyes Samuel | $60,000 |
Source: Public Records
Tax History Compared to Growth
Tax History
| Year | Tax Paid | Tax Assessment Tax Assessment Total Assessment is a certain percentage of the fair market value that is determined by local assessors to be the total taxable value of land and additions on the property. | Land | Improvement |
|---|---|---|---|---|
| 2025 | $7,019 | $178,150 | $25,830 | $152,320 |
| 2024 | $6,789 | $176,330 | $24,010 | $152,320 |
| 2023 | $6,559 | $176,330 | $24,010 | $152,320 |
| 2022 | $7,009 | $176,330 | $24,010 | $152,320 |
| 2021 | $4,684 | $106,750 | $20,650 | $86,100 |
| 2020 | $4,684 | $106,750 | $20,650 | $86,100 |
| 2019 | $4,588 | $106,750 | $20,650 | $86,100 |
| 2018 | $4,588 | $106,750 | $20,650 | $86,100 |
| 2017 | $4,129 | $106,750 | $20,650 | $86,100 |
| 2016 | $3,476 | $83,650 | $11,830 | $71,820 |
| 2015 | $3,476 | $83,650 | $11,830 | $71,820 |
| 2014 | $3,476 | $83,650 | $11,830 | $71,820 |
Source: Public Records
Map
Nearby Homes
- 45 Frank St
- 194 Ella T Grasso Blvd
- 29 White St
- 148 Rosette St
- 46 Hurlburt St
- 51 Arthur St
- 312 Davenport Ave
- 72 Daggett St
- 262 Davenport Ave
- 533 Howard Ave
- 23 Dewitt St
- 148 Plymouth St
- 247 Davenport Ave
- 231 Davenport Ave
- 133 Plymouth St
- 41 Cassius St
- 32 Lamberton St
- 82 1st St
- 26 Lamberton St
- 46 Liberty St