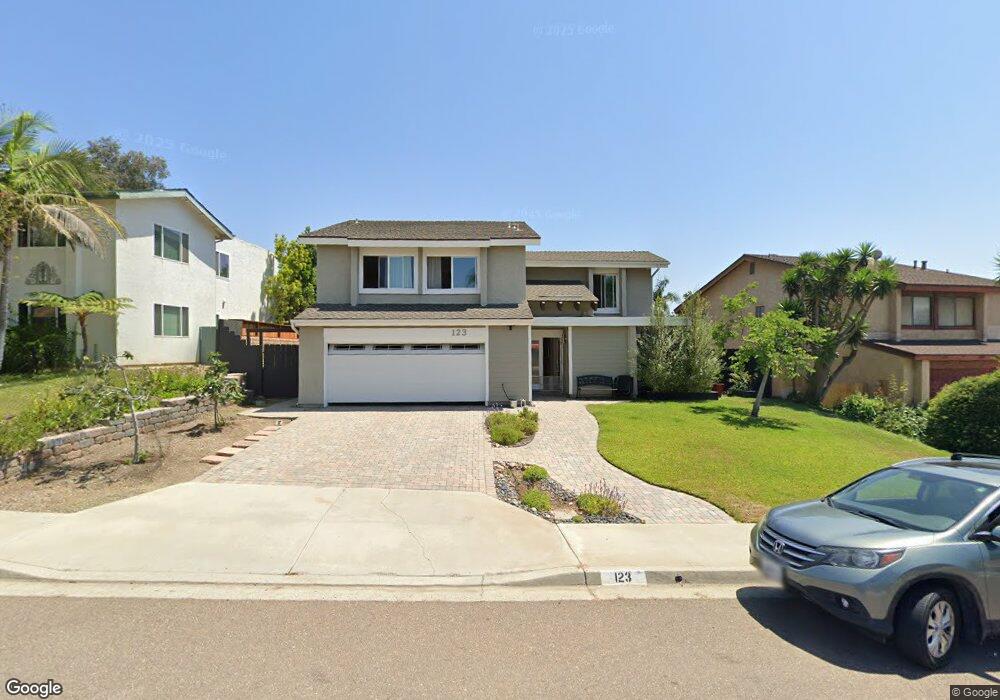
123 Honeycomb Ct Encinitas, CA 92024
Central Encinitas NeighborhoodEstimated Value: $1,874,410 - $1,910,000
5
Beds
3
Baths
2,297
Sq Ft
$824/Sq Ft
Est. Value
About This Home
This home is located at 123 Honeycomb Ct, Encinitas, CA 92024 and is currently estimated at $1,893,103, approximately $824 per square foot. 123 Honeycomb Ct is a home located in San Diego County with nearby schools including Park Dale Lane Elementary, Diegueno Middle School, and La Costa Canyon High School.
Ownership History
Date
Name
Owned For
Owner Type
Purchase Details
Closed on
Jan 24, 2013
Sold by
Forester Jess D and Forester Vicki
Bought by
Forester Jess D and Forester Vicki
Current Estimated Value
Home Financials for this Owner
Home Financials are based on the most recent Mortgage that was taken out on this home.
Original Mortgage
$250,000
Outstanding Balance
$174,116
Interest Rate
3.33%
Mortgage Type
New Conventional
Estimated Equity
$1,718,987
Purchase Details
Closed on
Sep 8, 1997
Sold by
Jeri Bonesteele
Bought by
Forester David and Forester Vicki
Home Financials for this Owner
Home Financials are based on the most recent Mortgage that was taken out on this home.
Original Mortgage
$196,500
Interest Rate
7.34%
Purchase Details
Closed on
Apr 30, 1992
Purchase Details
Closed on
Aug 18, 1987
Purchase Details
Closed on
Jul 15, 1986
Create a Home Valuation Report for This Property
The Home Valuation Report is an in-depth analysis detailing your home's value as well as a comparison with similar homes in the area
Home Values in the Area
Average Home Value in this Area
Purchase History
| Date | Buyer | Sale Price | Title Company |
|---|---|---|---|
| Forester Jess D | -- | Chicago Title Company | |
| Forester David | -- | Gateway Title Company | |
| -- | $235,000 | -- | |
| -- | $179,900 | -- | |
| -- | $162,000 | -- |
Source: Public Records
Mortgage History
| Date | Status | Borrower | Loan Amount |
|---|---|---|---|
| Open | Forester Jess D | $250,000 | |
| Closed | Forester David | $196,500 |
Source: Public Records
Tax History
| Year | Tax Paid | Tax Assessment Tax Assessment Total Assessment is a certain percentage of the fair market value that is determined by local assessors to be the total taxable value of land and additions on the property. | Land | Improvement |
|---|---|---|---|---|
| 2025 | $4,817 | $457,382 | $150,879 | $306,503 |
| 2024 | $4,817 | $399,395 | $147,921 | $251,474 |
| 2023 | $4,659 | $391,565 | $145,021 | $246,544 |
| 2022 | $4,533 | $383,888 | $142,178 | $241,710 |
| 2021 | $4,442 | $376,362 | $139,391 | $236,971 |
| 2020 | $4,358 | $372,504 | $137,962 | $234,542 |
| 2019 | $4,274 | $365,201 | $135,257 | $229,944 |
| 2018 | $4,209 | $358,041 | $132,605 | $225,436 |
| 2017 | $191 | $351,021 | $130,005 | $221,016 |
| 2016 | $4,017 | $344,139 | $127,456 | $216,683 |
| 2015 | $3,934 | $338,971 | $125,542 | $213,429 |
| 2014 | $3,833 | $332,332 | $123,083 | $209,249 |
Source: Public Records
Map
Nearby Homes
- 1741 Charleston Ln
- 1824 Eastwood Ln
- 1822 Stanton Rd Unit 302
- 245 Countryhaven Rd Unit 134
- 1644 Forestdale Dr
- 1926 Springdale Ln
- 1830 Gatepost Rd
- 324 Countrywood Ln
- 2118 Valleydale Ln
- 1517 Shields Ave
- 2037 Countrywood Way
- 1971 Azure Way
- 1709 Edgefield Ln
- 277 Via Del Cerrito
- 245 Fairlee Ln
- 1982 Fairlee Dr
- 349 Horizon Dr
- 1642 Blossom Field Way
- 516 Whisper Wind Dr
- 1733 Gentle Breeze Ln
- 115 Honeycomb Ct
- 131 Honeycomb Ct
- 124 Countryhaven Rd
- 116 Countryhaven Rd
- 107 Honeycomb Ct Unit 12
- 139 Honeycomb Ct
- 132 Countryhaven Rd
- 122 Honeycomb Ct
- 130 Honeycomb Ct
- 116 Honeycomb Ct
- 108 Countryhaven Rd
- 134 Honeycomb Ct
- 110 Honeycomb Ct
- 140 Countryhaven Rd
- 138 Honeycomb Ct
- 147 Honeycomb Ct
- 117 Little Oaks Rd
- 123 Little Oaks Rd
- 129 Little Oaks Rd
- 1937 Village Wood Rd Unit 12
Your Personal Tour Guide
Ask me questions while you tour the home.