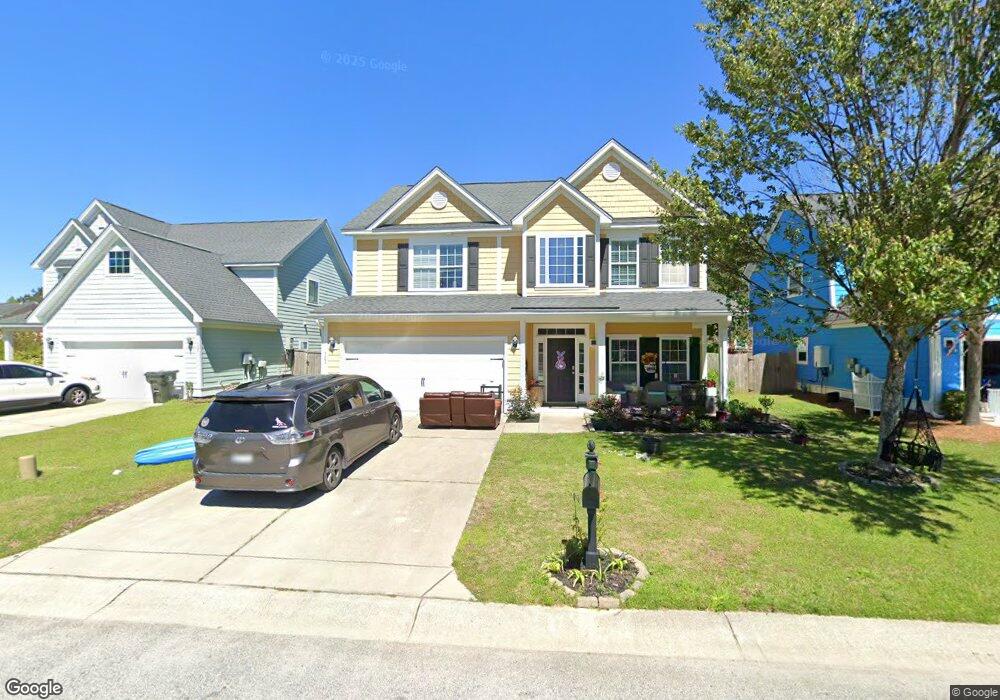
123 Indigo Marsh Cir Wando, SC 29492
Wando NeighborhoodEstimated Value: $610,428 - $673,000
4
Beds
3
Baths
2,241
Sq Ft
$289/Sq Ft
Est. Value
About This Home
This home is located at 123 Indigo Marsh Cir, Wando, SC 29492 and is currently estimated at $648,357, approximately $289 per square foot. 123 Indigo Marsh Cir is a home located in Berkeley County.
Ownership History
Date
Name
Owned For
Owner Type
Purchase Details
Closed on
Jul 21, 2016
Sold by
Anderson Larry L
Bought by
Streisel Sandra
Current Estimated Value
Home Financials for this Owner
Home Financials are based on the most recent Mortgage that was taken out on this home.
Original Mortgage
$310,500
Outstanding Balance
$248,032
Interest Rate
3.6%
Mortgage Type
New Conventional
Estimated Equity
$400,325
Purchase Details
Closed on
Apr 2, 2014
Sold by
Crescent Homes Sc Llc
Bought by
Anderson Larry L
Purchase Details
Closed on
May 24, 2013
Sold by
Cf Associates Llc
Bought by
Crescent Homes Sc Llc
Home Financials for this Owner
Home Financials are based on the most recent Mortgage that was taken out on this home.
Original Mortgage
$15,000,000
Interest Rate
3.37%
Mortgage Type
New Conventional
Create a Home Valuation Report for This Property
The Home Valuation Report is an in-depth analysis detailing your home's value as well as a comparison with similar homes in the area
Home Values in the Area
Average Home Value in this Area
Purchase History
| Date | Buyer | Sale Price | Title Company |
|---|---|---|---|
| Streisel Sandra | $345,000 | -- | |
| Anderson Larry L | $258,687 | -- | |
| Crescent Homes Sc Llc | $200,000 | -- |
Source: Public Records
Mortgage History
| Date | Status | Borrower | Loan Amount |
|---|---|---|---|
| Open | Streisel Sandra | $310,500 | |
| Previous Owner | Crescent Homes Sc Llc | $15,000,000 |
Source: Public Records
Tax History Compared to Growth
Tax History
| Year | Tax Paid | Tax Assessment Tax Assessment Total Assessment is a certain percentage of the fair market value that is determined by local assessors to be the total taxable value of land and additions on the property. | Land | Improvement |
|---|---|---|---|---|
| 2025 | $1,717 | $407,100 | $101,866 | $305,234 |
| 2024 | $1,653 | $16,284 | $4,075 | $12,209 |
| 2023 | $1,653 | $16,284 | $4,075 | $12,209 |
| 2022 | $5,777 | $14,160 | $3,000 | $11,160 |
| 2021 | $5,822 | $21,240 | $4,500 | $16,740 |
| 2020 | $5,845 | $21,240 | $4,500 | $16,740 |
| 2019 | $5,833 | $21,240 | $4,500 | $16,740 |
| 2018 | $1,621 | $12,548 | $2,400 | $10,148 |
| 2017 | $5,380 | $18,822 | $3,600 | $15,222 |
| 2016 | $1,284 | $20,140 | $3,900 | $16,240 |
| 2015 | $1,180 | $10,180 | $2,200 | $7,980 |
| 2014 | $2,253 | $9,800 | $2,000 | $7,800 |
| 2013 | -- | $9,800 | $2,000 | $7,800 |
Source: Public Records
Map
Nearby Homes
- 488 Nelliefield Trail
- 505 Spiral Ramp Ct
- 537 Spiral Ramp Ct
- 353 Glide Slope St
- 1221 Harriman Ln
- 549 Spiral Ramp Ct
- 1130 Peninsula Cove Dr
- 1129 River Bay Ln
- 1233 Harriman Ln
- 425 Kadinsky St
- 237 Newsday St
- 521 Spiral Ramp Ct
- 1261 Harriman Ln
- 1156 Marsh Harbor Ln
- 1258 Harriman Ln
- 259 Newsday St
- 252 Newsday St
- 404 Kandinsky St
- 1266 Harriman Ln
- 1436 Water Edge Dr
- 123 Indigo Marsh Cir
- 121 Indigo Marsh Cir
- 121 Indigo Marsh Cir
- 127 Indigo Marsh Cir
- 445 Nelliefield Trail
- 119 Indigo Marsh Cir
- 119 Indigo Marsh Cir
- 443 Nelliefield Trail
- 122 Indigo Marsh Cir
- 449 Nelliefield Trail
- 441 Nelliefield Trail
- 124 Indigo Marsh Cir
- 124 Indigo Marsh Cir
- 117 Indigo Marsh Cir
- 126 Indigo Marsh Cir
- 126 Indigo Marsh Cir
- 128 Indigo Marsh Cir
- 130 Indigo Marsh Cir
- 118 Indigo Marsh Cir
- 439 Nelliefield Trail