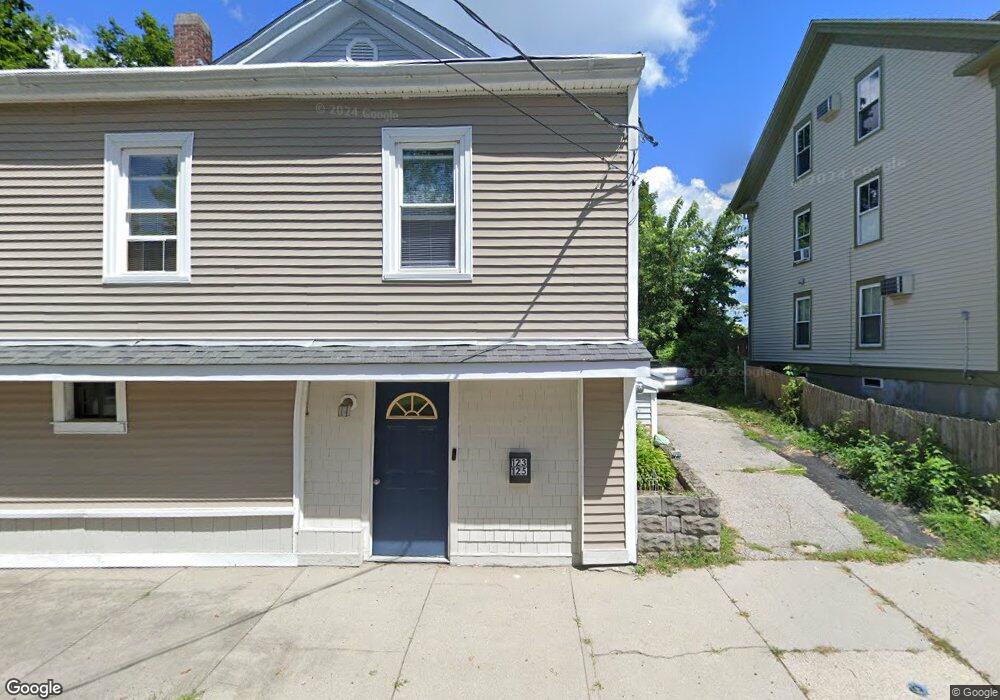
123 Jeffers St Woonsocket, RI 02895
Constitution Hill NeighborhoodEstimated Value: $387,000 - $585,000
2
Beds
1
Bath
1,877
Sq Ft
$239/Sq Ft
Est. Value
About This Home
This home is located at 123 Jeffers St, Woonsocket, RI 02895 and is currently estimated at $448,219, approximately $238 per square foot. 123 Jeffers St is a home located in Providence County with nearby schools including Woonsocket High School, Founders Academy, and Beacon Charter School.
Ownership History
Date
Name
Owned For
Owner Type
Purchase Details
Closed on
Jul 26, 2018
Sold by
Ri Housing & Mtg
Bought by
Shaw Susan
Current Estimated Value
Purchase Details
Closed on
May 31, 2013
Sold by
Soares Am E and Tortora Steven
Bought by
Shaw Hugh A and Mendall Jason
Purchase Details
Closed on
Nov 15, 2010
Sold by
White Karolye
Bought by
Shaw Hugh
Purchase Details
Closed on
Aug 11, 2010
Sold by
Shaw Hugh
Bought by
White Karolye
Create a Home Valuation Report for This Property
The Home Valuation Report is an in-depth analysis detailing your home's value as well as a comparison with similar homes in the area
Home Values in the Area
Average Home Value in this Area
Purchase History
| Date | Buyer | Sale Price | Title Company |
|---|---|---|---|
| Shaw Susan | $50,000 | -- | |
| Shaw Susan | $50,000 | -- | |
| Shaw Hugh A | $40,000 | -- | |
| Shaw Hugh A | $40,000 | -- | |
| Shaw Hugh | $3,891 | -- | |
| Shaw Hugh | $3,891 | -- | |
| White Karolye | $3,461 | -- | |
| White Karolye | $3,461 | -- |
Source: Public Records
Tax History
| Year | Tax Paid | Tax Assessment Tax Assessment Total Assessment is a certain percentage of the fair market value that is determined by local assessors to be the total taxable value of land and additions on the property. | Land | Improvement |
|---|---|---|---|---|
| 2025 | $3,975 | $354,000 | $56,100 | $297,900 |
| 2024 | $3,546 | $243,900 | $59,300 | $184,600 |
| 2023 | $3,410 | $243,900 | $59,300 | $184,600 |
| 2022 | $3,410 | $243,900 | $59,300 | $184,600 |
| 2021 | $2,931 | $123,400 | $25,300 | $98,100 |
| 2020 | $2,962 | $123,400 | $25,300 | $98,100 |
| 2018 | $2,971 | $123,400 | $25,300 | $98,100 |
| 2017 | $3,368 | $111,900 | $37,400 | $74,500 |
| 2016 | $3,563 | $111,900 | $37,400 | $74,500 |
| 2015 | $4,093 | $111,900 | $37,400 | $74,500 |
| 2014 | $3,961 | $110,200 | $41,100 | $69,100 |
Source: Public Records
Map
Nearby Homes
- 36 Fairmount St
- 0 Holbrook Ln Unit 1402850
- 83 4th Ave
- 115 Railroad St
- 99 Allen St Unit 205
- 379 Front St
- 180 Allen St Unit 104
- 58 Oakley Rd
- 435 S Main St
- 308 Harris Ave
- 190 Coe St
- 80 Summit St
- 122 Grand St
- 0 N Main St Unit 1401765
- 43 Summit St
- 35 Greene St
- 0 10th Ave
- 10 10th Ave
- 84 Bernice Ave
- 233 Grove St
Your Personal Tour Guide
Ask me questions while you tour the home.