123 Main St Nantucket, MA 02554
Estimated Value: $3,178,000 - $4,971,000
4
Beds
4
Baths
2,657
Sq Ft
$1,538/Sq Ft
Est. Value
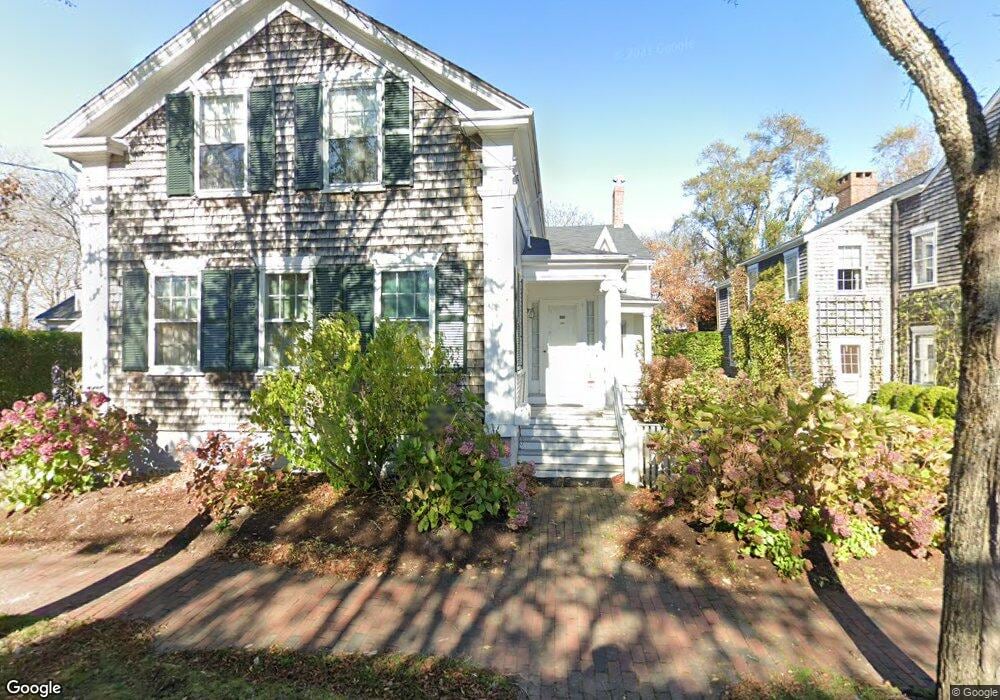
About This Home
This home is located at 123 Main St, Nantucket, MA 02554 and is currently estimated at $4,086,543, approximately $1,538 per square foot. 123 Main St is a home located in Nantucket County with nearby schools including Nantucket Elementary School, Cyrus Peirce Middle School, and Nantucket High School.
Ownership History
Date
Name
Owned For
Owner Type
Purchase Details
Closed on
Dec 19, 2024
Sold by
M E K De Esteban Ret and Curtis
Bought by
Curtis Jennifer A
Current Estimated Value
Purchase Details
Closed on
Oct 27, 2015
Sold by
Esteban Fernando M
Bought by
Fernando M Esteban Ret
Purchase Details
Closed on
Dec 7, 2007
Sold by
Esteban Margaret E
Bought by
Elliot Knopf Margaret and Esteban Fernando M
Create a Home Valuation Report for This Property
The Home Valuation Report is an in-depth analysis detailing your home's value as well as a comparison with similar homes in the area
Home Values in the Area
Average Home Value in this Area
Purchase History
| Date | Buyer | Sale Price | Title Company |
|---|---|---|---|
| Curtis Jennifer A | -- | None Available | |
| Curtis Jennifer A | -- | None Available | |
| Curtis Jennifer A | -- | None Available | |
| Fernando M Esteban Ret | -- | -- | |
| Fernando M Esteban Ret | -- | -- | |
| Elliot Knopf Margaret | -- | -- | |
| Knopf Margaret Elliot | -- | -- | |
| Fernando M Esteban Ret | -- | -- | |
| Knopf Margaret Elliot | -- | -- |
Source: Public Records
Tax History Compared to Growth
Tax History
| Year | Tax Paid | Tax Assessment Tax Assessment Total Assessment is a certain percentage of the fair market value that is determined by local assessors to be the total taxable value of land and additions on the property. | Land | Improvement |
|---|---|---|---|---|
| 2025 | $10,417 | $3,175,800 | $2,201,900 | $973,900 |
| 2024 | $9,990 | $3,191,700 | $2,242,700 | $949,000 |
| 2023 | $9,098 | $2,834,200 | $2,136,800 | $697,400 |
| 2022 | $95 | $2,532,700 | $1,947,000 | $585,700 |
| 2021 | $8,005 | $2,205,300 | $1,557,600 | $647,700 |
| 2020 | $8,399 | $2,434,500 | $1,687,400 | $747,100 |
| 2019 | $8,141 | $2,422,800 | $1,675,700 | $747,100 |
| 2018 | $6,007 | $2,159,900 | $1,611,300 | $548,600 |
| 2017 | $7,085 | $2,089,900 | $1,566,100 | $523,800 |
| 2016 | $6,903 | $2,054,400 | $1,546,800 | $507,600 |
| 2015 | $6,439 | $1,783,700 | $1,252,100 | $531,600 |
| 2014 | $6,707 | $1,783,700 | $1,252,100 | $531,600 |
Source: Public Records
Map
Nearby Homes