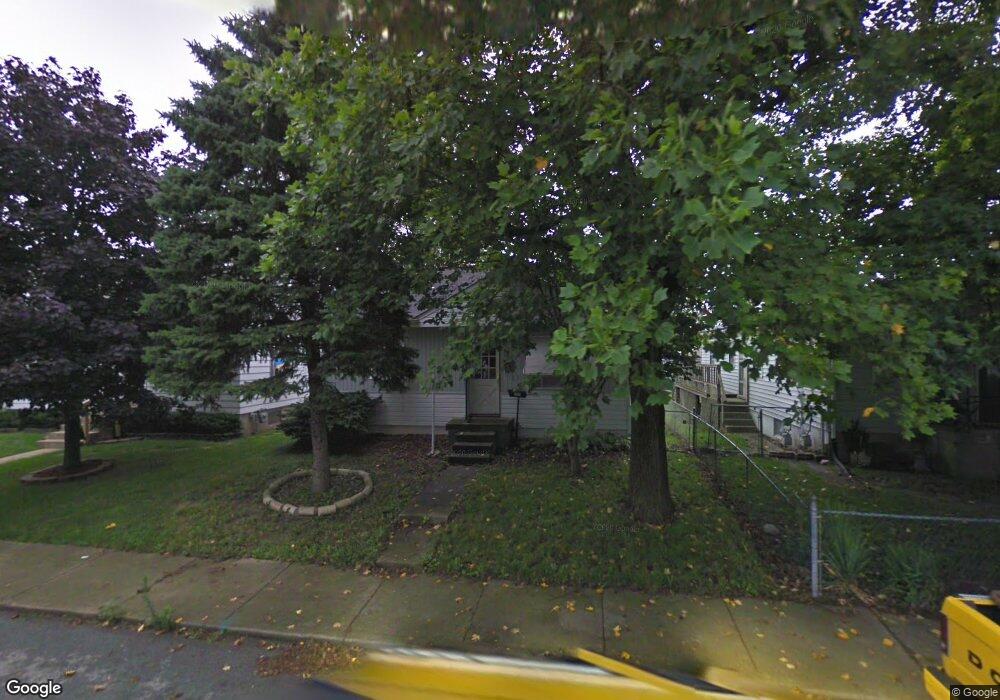
123 N 3rd Ave Beech Grove, IN 46107
Estimated Value: $138,000 - $159,000
2
Beds
1
Bath
1,440
Sq Ft
$104/Sq Ft
Est. Value
About This Home
This home is located at 123 N 3rd Ave, Beech Grove, IN 46107 and is currently estimated at $150,133, approximately $104 per square foot. 123 N 3rd Ave is a home located in Marion County with nearby schools including Hornet Park Elementary School, Central Elementary School, and South Grove Intermediate School.
Ownership History
Date
Name
Owned For
Owner Type
Purchase Details
Closed on
Nov 20, 2019
Sold by
Ertel Holly A
Bought by
Arnett Terry L
Current Estimated Value
Home Financials for this Owner
Home Financials are based on the most recent Mortgage that was taken out on this home.
Original Mortgage
$78,570
Outstanding Balance
$68,368
Interest Rate
3.6%
Mortgage Type
New Conventional
Estimated Equity
$81,765
Purchase Details
Closed on
Mar 24, 2010
Sold by
Christman Ed
Bought by
Ertel Holly A
Home Financials for this Owner
Home Financials are based on the most recent Mortgage that was taken out on this home.
Original Mortgage
$65,786
Interest Rate
5.25%
Mortgage Type
FHA
Purchase Details
Closed on
Aug 28, 2009
Sold by
Citimortgage Inc
Bought by
Christman Ed
Purchase Details
Closed on
Jul 23, 2009
Sold by
Wade December E
Bought by
Citimortgage Inc
Create a Home Valuation Report for This Property
The Home Valuation Report is an in-depth analysis detailing your home's value as well as a comparison with similar homes in the area
Home Values in the Area
Average Home Value in this Area
Purchase History
| Date | Buyer | Sale Price | Title Company |
|---|---|---|---|
| Arnett Terry L | $81,000 | Security Title | |
| Ertel Holly A | -- | Investors Titlecorp | |
| Christman Ed | -- | None Available | |
| Citimortgage Inc | $23,775 | None Available |
Source: Public Records
Mortgage History
| Date | Status | Borrower | Loan Amount |
|---|---|---|---|
| Open | Arnett Terry L | $78,570 | |
| Previous Owner | Ertel Holly A | $65,786 |
Source: Public Records
Tax History
| Year | Tax Paid | Tax Assessment Tax Assessment Total Assessment is a certain percentage of the fair market value that is determined by local assessors to be the total taxable value of land and additions on the property. | Land | Improvement |
|---|---|---|---|---|
| 2025 | $1,276 | $101,300 | $18,000 | $83,300 |
| 2024 | $1,627 | $102,100 | $18,000 | $84,100 |
| 2023 | $1,627 | $94,300 | $18,000 | $76,300 |
| 2022 | $1,056 | $85,500 | $18,000 | $67,500 |
| 2021 | $797 | $73,200 | $18,000 | $55,200 |
| 2020 | $670 | $67,400 | $18,000 | $49,400 |
| 2019 | $574 | $58,100 | $10,800 | $47,300 |
| 2018 | $637 | $58,000 | $10,800 | $47,200 |
| 2017 | $563 | $53,900 | $10,800 | $43,100 |
| 2016 | $576 | $52,200 | $10,800 | $41,400 |
| 2014 | $527 | $52,900 | $10,800 | $42,100 |
| 2013 | $570 | $52,900 | $10,800 | $42,100 |
Source: Public Records
Map
Nearby Homes
- 137 N 4th Ave
- 243 N 5th Ave
- 100 N 6th Ave
- 61 N 8th Ave
- 237 N 8th Ave
- 106 S 3rd Ave
- 112 S 3rd Ave
- 116 S 3rd Ave
- 122 S 3rd Ave
- 219 N 9th Ave
- 65 S 8th Ave
- 3236 S Emerson Ave
- 83 S 8th Ave
- 154 S 4th Ave
- 1005 Main St
- 5409 Bierman Rd
- 847 Churchman Ave
- 1510 Churchman Ave
- 2021 Prospect St
- 1639 E Southern Ave
Your Personal Tour Guide
Ask me questions while you tour the home.