Estimated Value: $68,331
--
Bed
--
Bath
1,028
Sq Ft
$66/Sq Ft
Est. Value
About This Home
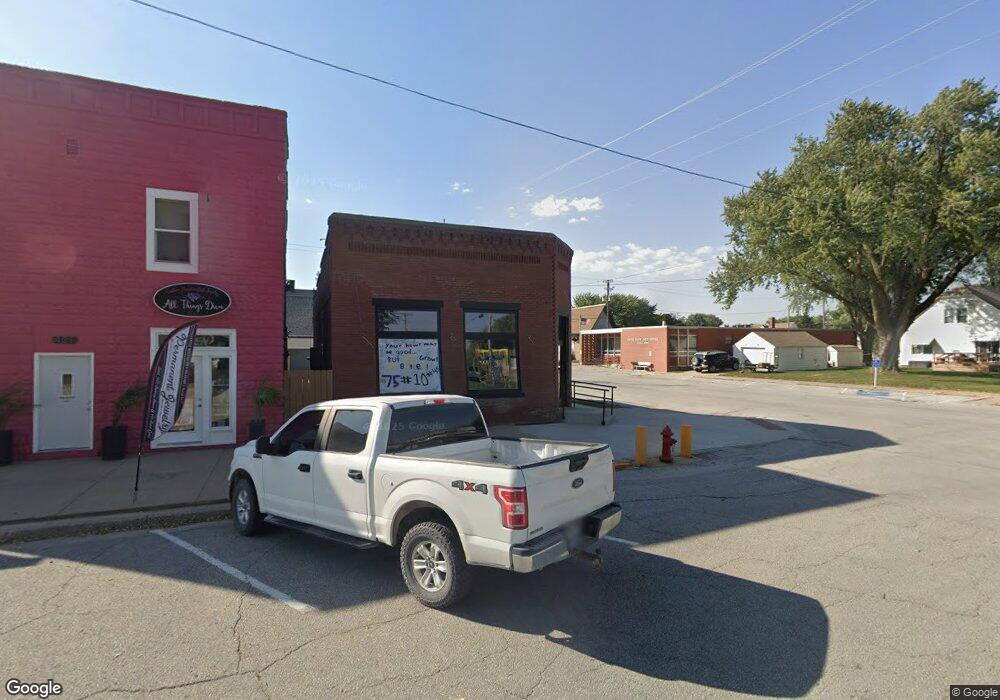
This home is located at 123 N 4th Ave, Logan, IA 51546 and is currently estimated at $68,331, approximately $66 per square foot. 123 N 4th Ave is a home located in Harrison County with nearby schools including Logan-Magnolia Elementary School and Logan-Magnolia Junior/Senior High School.
Ownership History
Date
Name
Owned For
Owner Type
Purchase Details
Closed on
Apr 10, 2025
Sold by
Vaughn Carrie W and Busing Matthew D
Bought by
Map Dot Holdings Llc
Current Estimated Value
Purchase Details
Closed on
Sep 20, 2021
Sold by
Bunkhouse Cafe Llc
Bought by
Busing Matthew D and Busing Carrie W
Home Financials for this Owner
Home Financials are based on the most recent Mortgage that was taken out on this home.
Original Mortgage
$90,000
Interest Rate
2.7%
Mortgage Type
Credit Line Revolving
Purchase Details
Closed on
Mar 20, 2020
Sold by
Bunkhouse Cafe Llc
Bought by
Rowe Matthew R and Rowe Melissa L
Purchase Details
Closed on
Mar 19, 2014
Sold by
Mclntosh Donna Julia
Bought by
Bunkhouse Cafe Llc
Create a Home Valuation Report for This Property
The Home Valuation Report is an in-depth analysis detailing your home's value as well as a comparison with similar homes in the area
Home Values in the Area
Average Home Value in this Area
Purchase History
| Date | Buyer | Sale Price | Title Company |
|---|---|---|---|
| Map Dot Holdings Llc | -- | None Listed On Document | |
| Busing Matthew D | $40,000 | None Listed On Document | |
| Rowe Matthew R | $45,000 | None Available | |
| Bunkhouse Cafe Llc | $42,000 | None Available |
Source: Public Records
Mortgage History
| Date | Status | Borrower | Loan Amount |
|---|---|---|---|
| Previous Owner | Busing Matthew D | $90,000 |
Source: Public Records
Tax History Compared to Growth
Tax History
| Year | Tax Paid | Tax Assessment Tax Assessment Total Assessment is a certain percentage of the fair market value that is determined by local assessors to be the total taxable value of land and additions on the property. | Land | Improvement |
|---|---|---|---|---|
| 2025 | $642 | $41,190 | $4,560 | $36,630 |
| 2024 | $642 | $36,570 | $4,560 | $32,010 |
| 2023 | $602 | $35,520 | $4,560 | $30,960 |
| 2022 | $548 | $28,077 | $4,560 | $23,517 |
| 2021 | $548 | $28,077 | $4,560 | $23,517 |
| 2020 | $532 | $28,077 | $4,560 | $23,517 |
| 2019 | $842 | $28,077 | $4,560 | $23,517 |
| 2018 | $824 | $42,031 | $0 | $0 |
| 2017 | $824 | $42,031 | $0 | $0 |
| 2016 | $864 | $42,031 | $0 | $0 |
| 2015 | $864 | $30,457 | $0 | $0 |
| 2014 | $614 | $30,457 | $0 | $0 |
Source: Public Records
Map
Nearby Homes
- 114 E 10th St
- 124 Glen Ave
- 721 Glen Rd
- 1010 Skyline Dr
- 415 Wessar Dr
- Lot 18 Mulligan Trail
- 2607 220th St
- 2144 Norton Ave
- LOT 27 Mulligan Trail
- 2484 280th St
- LOT 26 Lmvcc Estates
- 2464 Mulligan Trail
- LOT 20 Lmvcc Estates
- LOT 17 Lmvcc Estates
- Lot 17 Lmvcc Estates Trail
- LOT 15 Mulligan Trail
- 2853 Preston Place
- 2740 Whitetail Dr
- LOT D Fieldcrest Dr
- LOT E & K Fieldcrest Dr