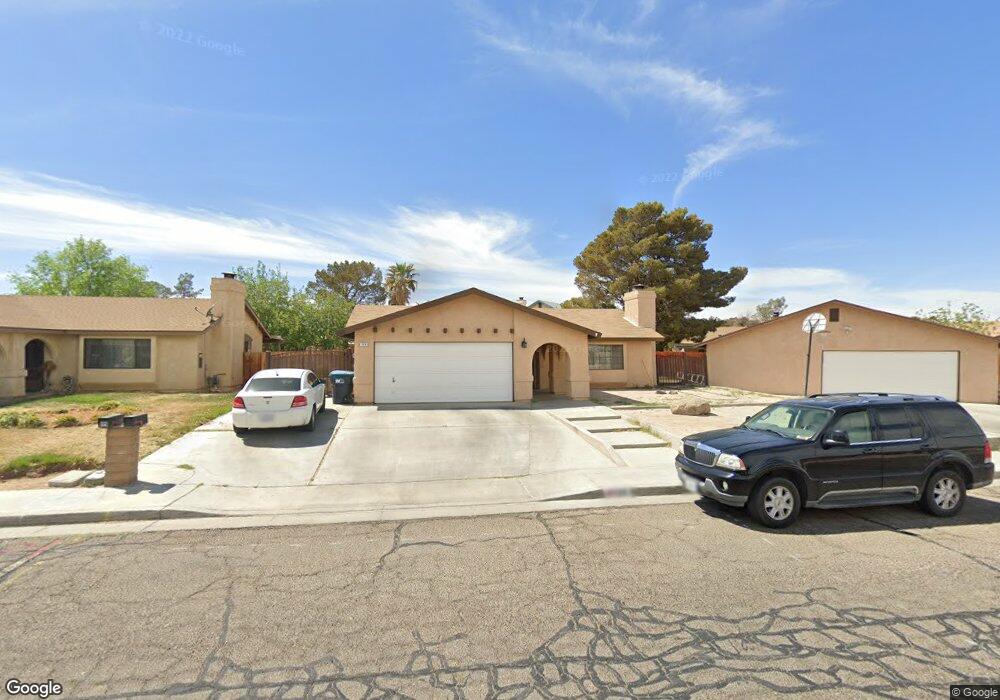
123 N Broadway St Unit D Ridgecrest, CA 93555
Estimated Value: $192,000 - $296,000
4
Beds
2
Baths
1,603
Sq Ft
$159/Sq Ft
Est. Value
About This Home
This home is located at 123 N Broadway St Unit D, Ridgecrest, CA 93555 and is currently estimated at $254,372, approximately $158 per square foot. 123 N Broadway St Unit D is a home located in Kern County with nearby schools including Pierce Elementary School, Murray Middle School, and Burroughs High School.
Ownership History
Date
Name
Owned For
Owner Type
Purchase Details
Closed on
Jun 11, 2025
Sold by
Townsend Nicholas E and Townsend Cheryl E
Bought by
Marsh Jeremy and Marsh Sarah
Current Estimated Value
Purchase Details
Closed on
Sep 16, 2020
Sold by
Rogers Michael James
Bought by
Townsend Nicholas E and Townsend Cheryl E
Home Financials for this Owner
Home Financials are based on the most recent Mortgage that was taken out on this home.
Original Mortgage
$206,497
Interest Rate
2.8%
Mortgage Type
New Conventional
Purchase Details
Closed on
Jan 16, 2019
Sold by
Rogers Michelle L
Bought by
Rogers Michael J
Home Financials for this Owner
Home Financials are based on the most recent Mortgage that was taken out on this home.
Interest Rate
4.45%
Purchase Details
Closed on
Dec 22, 2010
Sold by
Busby Steven W and Busby Margaret E
Bought by
Rogers Michael James and Rogers Michelle Lynn
Home Financials for this Owner
Home Financials are based on the most recent Mortgage that was taken out on this home.
Original Mortgage
$191,020
Interest Rate
4.84%
Mortgage Type
VA
Create a Home Valuation Report for This Property
The Home Valuation Report is an in-depth analysis detailing your home's value as well as a comparison with similar homes in the area
Home Values in the Area
Average Home Value in this Area
Purchase History
| Date | Buyer | Sale Price | Title Company |
|---|---|---|---|
| Marsh Jeremy | $189,000 | Navy Federal Title | |
| Townsend Nicholas E | $203,000 | First American Title Company | |
| Rogers Michael J | -- | -- | |
| Rogers Michael James | $189,000 | Placer Title Company |
Source: Public Records
Mortgage History
| Date | Status | Borrower | Loan Amount |
|---|---|---|---|
| Previous Owner | Townsend Nicholas E | $206,497 | |
| Previous Owner | Rogers Michael J | -- | |
| Previous Owner | Rogers Michael James | $191,020 | |
| Closed | Rogers Michael J | $0 |
Source: Public Records
Tax History Compared to Growth
Tax History
| Year | Tax Paid | Tax Assessment Tax Assessment Total Assessment is a certain percentage of the fair market value that is determined by local assessors to be the total taxable value of land and additions on the property. | Land | Improvement |
|---|---|---|---|---|
| 2025 | $2,929 | $219,731 | $32,472 | $187,259 |
| 2024 | $2,929 | $215,424 | $31,836 | $183,588 |
| 2023 | $2,844 | $211,201 | $31,212 | $179,989 |
| 2022 | $2,787 | $207,060 | $30,600 | $176,460 |
| 2021 | $2,709 | $203,000 | $30,000 | $173,000 |
| 2020 | $2,312 | $177,029 | $28,547 | $148,482 |
| 2019 | $2,274 | $177,029 | $28,547 | $148,482 |
| 2018 | $2,232 | $170,157 | $27,440 | $142,717 |
| 2017 | $2,224 | $166,821 | $26,902 | $139,919 |
| 2016 | $2,023 | $153,000 | $38,000 | $115,000 |
| 2015 | $1,715 | $125,000 | $31,000 | $94,000 |
| 2014 | $1,914 | $154,000 | $39,000 | $115,000 |
Source: Public Records
Map
Nearby Homes
- 142 Chambers St Unit K
- 124 Jacquelyn Ct
- 1 E Ridgecrest Blvd
- 625 Cottonwood Dr
- 134 N American St
- 0 S Gateway Blvd
- 632-A Commercial
- 729 N Sunland Dr Unit H
- 2005 S American St
- 112 Valley St
- 525 E Ridgecrest Blvd Unit 11
- 217 S American St
- 645 E Church Ave
- 504 Commercial Ave Unit A
- 228 S Greenlawn St
- 0 E Ridgecrest Blvd
- 205 Rancho St
- 314 Reese St
- 1006 E Church Ave
- 320 S Gateway Blvd
- 119 N Broadway St
- 136 N Gwen Dr Unit C
- 130 N Gwen Dr Unit C
- 140 N Gwen Dr
- 124 N Gwen Dr
- 122 N Broadway St
- 118 N Broadway St
- 724 Cottonwood Dr
- 720 Cottonwood Dr
- 126 N Broadway St
- 118 N Gwen Dr Unit C
- 114 N Broadway St Unit D
- 716 Cottonwood Dr
- 130 N Broadway St Unit D
- 110 N Broadway St
- 131 N Gwen Dr Unit C
- 102 N Broadway St
- 135 N Gwen Dr Unit C
- 712 Cottonwood Dr Unit C
- 134 N Broadway St Unit C