
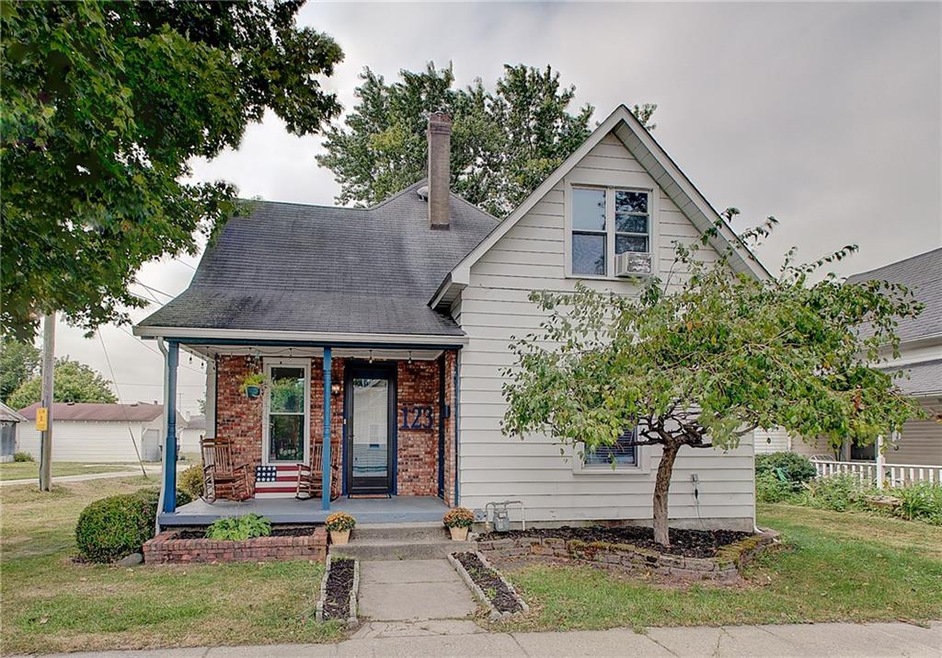

123 N John St Pendleton, IN 46064
4
Beds
2
Baths
2,489
Sq Ft
4,487
Sq Ft Lot
Highlights
- Vaulted Ceiling
- Covered patio or porch
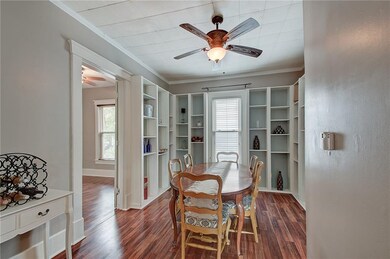
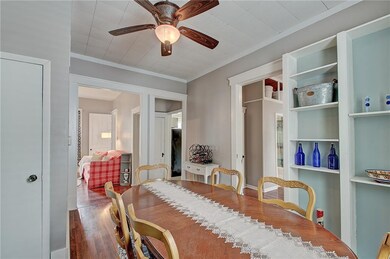
- Built-in Bookshelves
- Traditional Architecture
- Formal Dining Room
- 4-minute walk to Falls Park
About This Home
As of January 2021Location Location Location in Downtown Pendleton! Enjoy walks to shops, restaurants, and Falls Park! This home boasts 4 beds 2 full baths. Newer kitchen with attached breakfast room, perfect for an eat-in table, along with a separate formal dining room with built-in bookcases. Attached workshop off laundry on main floor! Second floor with additional bedroom and large Master Suite with two large closets and private full bath.
Last Agent to Sell the Property
The Real Estate Group License #RB14035766 Listed on: 09/11/2020
Last Buyer's Agent
Candi Smith
CENTURY 21 Scheetz
Home Details
Home Type
- Single Family
Est. Annual Taxes
- $1,136
Year Built
- Built in 1898
Home Design
- Traditional Architecture
- Vinyl Construction Material
Interior Spaces
- 2-Story Property
- Built-in Bookshelves
- Woodwork
- Vaulted Ceiling
- Formal Dining Room
- Crawl Space
- Attic Access Panel
- Fire and Smoke Detector
Kitchen
- Gas Oven
- Dishwasher
- Disposal
Bedrooms and Bathrooms
- 4 Bedrooms
Utilities
- Forced Air Heating and Cooling System
- Heating System Uses Gas
- Gas Water Heater
Additional Features
- Covered patio or porch
- 4,487 Sq Ft Lot
Community Details
- Andersons Subdivision
Listing and Financial Details
- Assessor Parcel Number 481421201107000013
Ownership History
Date
Name
Owned For
Owner Type
Purchase Details
Listed on
Sep 11, 2020
Closed on
Jan 20, 2021
Sold by
Goff Eric K
Bought by
Nesbit Adam
Seller's Agent
Mallorie Wilson
The Real Estate Group
Buyer's Agent
Candi Smith
CENTURY 21 Scheetz
List Price
$210,000
Sold Price
$191,000
Premium/Discount to List
-$19,000
-9.05%
Current Estimated Value
Home Financials for this Owner
Home Financials are based on the most recent Mortgage that was taken out on this home.
Estimated Appreciation
$109,796
Avg. Annual Appreciation
10.17%
Original Mortgage
$187,540
Outstanding Balance
$169,664
Interest Rate
2.71%
Mortgage Type
FHA
Estimated Equity
$125,902
Purchase Details
Listed on
May 21, 2018
Closed on
Jun 3, 2018
Sold by
Stephens Jason B and Stephens Kendra M
Bought by
Goff Eric K
Seller's Agent
Kristie Bell
K.Bell Realty Group LLC
Buyer's Agent
Kristie Bell
K.Bell Realty Group LLC
List Price
$150,000
Sold Price
$153,500
Premium/Discount to List
$3,500
2.33%
Home Financials for this Owner
Home Financials are based on the most recent Mortgage that was taken out on this home.
Avg. Annual Appreciation
8.95%
Original Mortgage
$155,808
Interest Rate
4.5%
Mortgage Type
New Conventional
Purchase Details
Listed on
Jun 29, 2016
Closed on
Sep 2, 2016
Sold by
Titus Steven and Titus Deborah
Bought by
Stephens Jason B and Stephens Kendra M
Seller's Agent
Julie Schnepp
RE/MAX Legacy
Buyer's Agent
Nicholas Rogers
RE/MAX Legacy
List Price
$134,900
Sold Price
$123,000
Premium/Discount to List
-$11,900
-8.82%
Home Financials for this Owner
Home Financials are based on the most recent Mortgage that was taken out on this home.
Avg. Annual Appreciation
12.87%
Original Mortgage
$126,478
Interest Rate
3.48%
Mortgage Type
New Conventional
Purchase Details
Closed on
May 1, 2013
Sold by
Hathcoat Paul M
Bought by
Titus Steven and Titus Deborah
Purchase Details
Closed on
Aug 31, 2005
Sold by
Keyser Michael D and Keyser Wendy F
Bought by
Hathcoat Paul M
Home Financials for this Owner
Home Financials are based on the most recent Mortgage that was taken out on this home.
Original Mortgage
$84,940
Interest Rate
6.01%
Mortgage Type
USDA
Similar Homes in Pendleton, IN
Create a Home Valuation Report for This Property
The Home Valuation Report is an in-depth analysis detailing your home's value as well as a comparison with similar homes in the area
Home Values in the Area
Average Home Value in this Area
Purchase History
| Date | Type | Sale Price | Title Company |
|---|---|---|---|
| Warranty Deed | -- | None Available | |
| Warranty Deed | -- | None Available | |
| Warranty Deed | -- | Fidelity National Title | |
| Warranty Deed | -- | -- | |
| Warranty Deed | -- | -- |
Source: Public Records
Mortgage History
| Date | Status | Loan Amount | Loan Type |
|---|---|---|---|
| Open | $187,540 | FHA | |
| Previous Owner | $155,808 | New Conventional | |
| Previous Owner | $126,478 | New Conventional | |
| Previous Owner | $84,940 | USDA | |
| Previous Owner | $0 | Unknown |
Source: Public Records
Property History
| Date | Event | Price | Change | Sq Ft Price |
|---|---|---|---|---|
| 01/20/2021 01/20/21 | Sold | $191,000 | -0.5% | $77 / Sq Ft |
| 12/14/2020 12/14/20 | Pending | -- | -- | -- |
| 12/10/2020 12/10/20 | Price Changed | $192,000 | -3.5% | $77 / Sq Ft |
| 10/27/2020 10/27/20 | Price Changed | $199,000 | -4.3% | $80 / Sq Ft |
| 09/30/2020 09/30/20 | Price Changed | $208,000 | -1.0% | $84 / Sq Ft |
| 09/11/2020 09/11/20 | For Sale | $210,000 | +36.8% | $84 / Sq Ft |
| 07/03/2018 07/03/18 | Sold | $153,500 | +2.3% | $62 / Sq Ft |
| 05/21/2018 05/21/18 | Pending | -- | -- | -- |
| 05/21/2018 05/21/18 | For Sale | $150,000 | +22.0% | $60 / Sq Ft |
| 09/02/2016 09/02/16 | Sold | $123,000 | -1.5% | $49 / Sq Ft |
| 08/04/2016 08/04/16 | Pending | -- | -- | -- |
| 07/27/2016 07/27/16 | Price Changed | $124,900 | -3.8% | $50 / Sq Ft |
| 07/13/2016 07/13/16 | Price Changed | $129,900 | -1.5% | $52 / Sq Ft |
| 07/11/2016 07/11/16 | Price Changed | $131,900 | -2.2% | $53 / Sq Ft |
| 06/29/2016 06/29/16 | For Sale | $134,900 | -- | $54 / Sq Ft |
Source: MIBOR Broker Listing Cooperative®
Tax History Compared to Growth
Tax History
| Year | Tax Paid | Tax Assessment Tax Assessment Total Assessment is a certain percentage of the fair market value that is determined by local assessors to be the total taxable value of land and additions on the property. | Land | Improvement |
|---|---|---|---|---|
| 2024 | $2,026 | $202,600 | $18,300 | $184,300 |
| 2023 | $1,870 | $187,000 | $17,400 | $169,600 |
| 2022 | $1,881 | $188,100 | $16,600 | $171,500 |
| 2021 | $1,759 | $175,900 | $16,600 | $159,300 |
| 2020 | $1,459 | $133,900 | $15,800 | $118,100 |
| 2019 | $1,338 | $133,800 | $15,800 | $118,000 |
| 2018 | $1,231 | $123,100 | $15,800 | $107,300 |
| 2017 | $1,136 | $113,600 | $14,700 | $98,900 |
| 2016 | $1,215 | $121,500 | $14,700 | $106,800 |
| 2014 | $1,950 | $97,500 | $14,700 | $82,800 |
| 2013 | $1,950 | $96,500 | $14,700 | $81,800 |
Source: Public Records
Agents Affiliated with this Home
-
Mallorie Wilson
Seller's Agent in 2021
Mallorie Wilson
The Real Estate Group
(317) 590-3434
2 in this area
221 Total Sales
-
C
Buyer's Agent in 2021
Candi Smith
CENTURY 21 Scheetz
-
K
Seller's Agent in 2018
Kristie Bell
K.Bell Realty Group LLC
-
Julie Schnepp
Seller's Agent in 2016
Julie Schnepp
RE/MAX Legacy
(765) 617-9430
163 in this area
379 Total Sales
-
T
Seller Co-Listing Agent in 2016
Tim Schnepp
-
N
Buyer's Agent in 2016
Nicholas Rogers
RE/MAX
Map
Source: MIBOR Broker Listing Cooperative®
MLS Number: MBR21738308
APN: 48-14-21-201-107.000-013
Disclaimer: Certain information contained herein is derived from information provided by parties other than Homes.com. All information provided is deemed reliable, but is not guaranteed to be accurate and should be independently verified.
![]() Based on information submitted to the MLS GRID. All data is obtained from various sources and may not have been verified by broker or MLS GRID. Supplied Open House Information is subject to change without notice. All information should be independently reviewed and verified for accuracy. Properties may or may not be listed by the office/agent presenting the information. Some IDX listings have been excluded from this website.
Based on information submitted to the MLS GRID. All data is obtained from various sources and may not have been verified by broker or MLS GRID. Supplied Open House Information is subject to change without notice. All information should be independently reviewed and verified for accuracy. Properties may or may not be listed by the office/agent presenting the information. Some IDX listings have been excluded from this website.
Nearby Homes
- 209 N John St
- 234 S East St
- 315 W High St
- 404 Pearl St
- 400 W State St
- 238 Jefferson St
- 484 Mallard Dr
- 6972 S 300 W
- 6733 S Cross St
- 6616 S Cross St
- 338 Limerick Ln
- 658 Donegal Dr
- 9801 Zion Way
- 9806 Olympic Blvd
- 634 Kilmore Dr
- 278 Evening Bay Ct
- 1673 Creek Bed Ln
- 1689 Maplewood Ln
- 1666 Huntzinger Blvd
- 1014 Gray Squirrel Dr