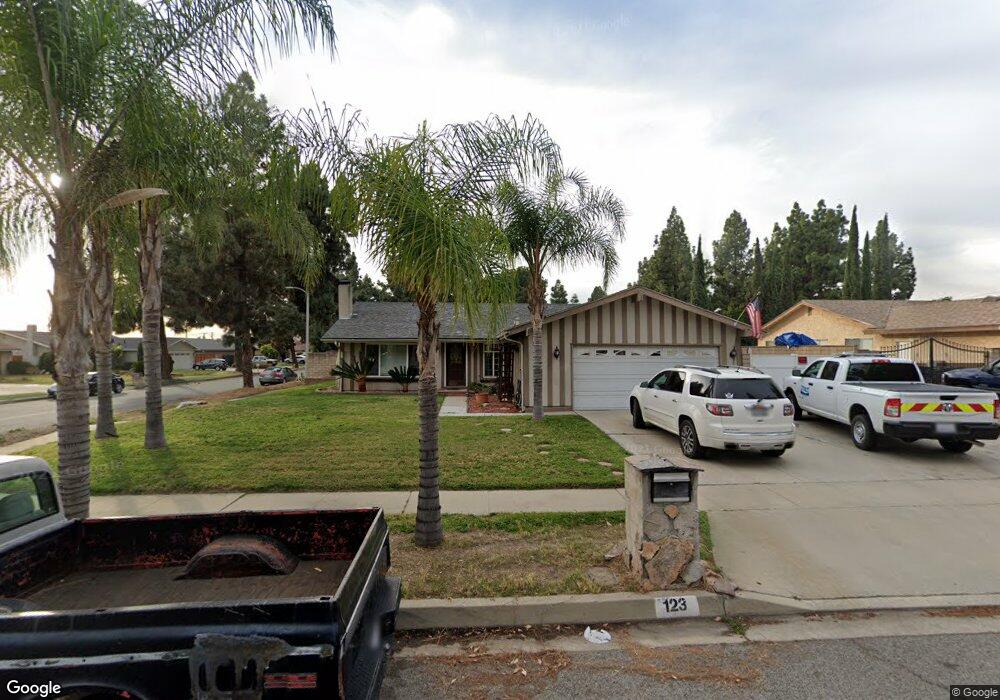
123 N Shasta Way Upland, CA 91786
Estimated Value: $706,000 - $776,000
4
Beds
2
Baths
1,551
Sq Ft
$478/Sq Ft
Est. Value
About This Home
This home is located at 123 N Shasta Way, Upland, CA 91786 and is currently estimated at $741,978, approximately $478 per square foot. 123 N Shasta Way is a home located in San Bernardino County with nearby schools including Baldy View Elementary School, Upland Junior High School, and Upland High School.
Ownership History
Date
Name
Owned For
Owner Type
Purchase Details
Closed on
Feb 8, 2011
Sold by
U S Bank National Association
Bought by
Malloy Jeffrey P and Malloy Carrie A
Current Estimated Value
Home Financials for this Owner
Home Financials are based on the most recent Mortgage that was taken out on this home.
Original Mortgage
$287,521
Outstanding Balance
$196,463
Interest Rate
4.75%
Mortgage Type
FHA
Estimated Equity
$545,515
Purchase Details
Closed on
Jul 23, 2010
Sold by
Alcala Phillip B
Bought by
U S Bank National Association
Purchase Details
Closed on
Jun 13, 2006
Sold by
Alcala Stacy
Bought by
Alcala Phillip B
Home Financials for this Owner
Home Financials are based on the most recent Mortgage that was taken out on this home.
Original Mortgage
$340,000
Interest Rate
7.15%
Mortgage Type
Stand Alone First
Purchase Details
Closed on
Feb 9, 1998
Sold by
Corregia Brent A and Correggia Susan M
Bought by
Sibert Glen Allen and Sibert Catherine J
Home Financials for this Owner
Home Financials are based on the most recent Mortgage that was taken out on this home.
Original Mortgage
$119,200
Interest Rate
8.5%
Create a Home Valuation Report for This Property
The Home Valuation Report is an in-depth analysis detailing your home's value as well as a comparison with similar homes in the area
Home Values in the Area
Average Home Value in this Area
Purchase History
| Date | Buyer | Sale Price | Title Company |
|---|---|---|---|
| Malloy Jeffrey P | $295,000 | Lsi Title Company Ca | |
| U S Bank National Association | $280,531 | Accommodation | |
| Alcala Phillip B | -- | Chicago Title Company | |
| Alcala Phillip B | $425,000 | Chicago Title Company | |
| Sibert Glen Allen | $149,000 | Chicago Title Co |
Source: Public Records
Mortgage History
| Date | Status | Borrower | Loan Amount |
|---|---|---|---|
| Open | Malloy Jeffrey P | $287,521 | |
| Previous Owner | Alcala Phillip B | $340,000 | |
| Previous Owner | Alcala Phillip B | $85,000 | |
| Previous Owner | Sibert Glen Allen | $119,200 | |
| Closed | Sibert Glen Allen | $22,350 |
Source: Public Records
Tax History Compared to Growth
Tax History
| Year | Tax Paid | Tax Assessment Tax Assessment Total Assessment is a certain percentage of the fair market value that is determined by local assessors to be the total taxable value of land and additions on the property. | Land | Improvement |
|---|---|---|---|---|
| 2025 | $4,127 | $377,947 | $131,961 | $245,986 |
| 2024 | $4,127 | $370,537 | $129,374 | $241,163 |
| 2023 | $4,064 | $363,271 | $126,837 | $236,434 |
| 2022 | $3,977 | $356,148 | $124,350 | $231,798 |
| 2021 | $3,971 | $349,165 | $121,912 | $227,253 |
| 2020 | $3,863 | $345,585 | $120,662 | $224,923 |
| 2019 | $3,851 | $338,809 | $118,296 | $220,513 |
| 2018 | $3,758 | $332,165 | $115,976 | $216,189 |
| 2017 | $3,650 | $325,652 | $113,702 | $211,950 |
| 2016 | $3,448 | $319,267 | $111,473 | $207,794 |
| 2015 | $3,370 | $314,472 | $109,799 | $204,673 |
| 2014 | $3,283 | $308,312 | $107,648 | $200,664 |
Source: Public Records
Map
Nearby Homes
- 537 W 9th St
- 435 W 9th St Unit F5
- 435 W 9th St Unit B3
- 164 Euclid Place
- 228 Greentree Rd
- 173 W 8th St
- 173 Elizabeth Ln
- Plan 3 at Towns on First - Towns On First
- Plan 4 at Towns on First - Towns On First
- 119 N 1st Ave
- 384 W 7th St
- 424 W 7th St
- 345 S Euclid Ave
- 595 Juniper Ave
- 340 W Caroline Ct
- 855 N Palm Ave
- 384 Ruby Red Ln
- 144 Dorsett Ave
- 181 Dorsett Ave
- 371 S Alexander Ave
- 143 N Shasta Way
- 124 N Tulare Way
- 142 N Tulare Way
- 536 Pearl St
- 159 N Shasta Way
- 122 N Shasta Way
- 554 Pearl St
- 140 N Shasta Way
- 156 N Tulare Way
- 512 Pearl St
- 576 Pearl St
- 158 N Shasta Way
- 496 Pearl St
- 600 Pearl St
- 544 W 9th St
- 121 N Tulare Way
- 176 N Shasta Way
- 578 W 9th St
- 137 N Tulare Way
- 123 Lucerne Way