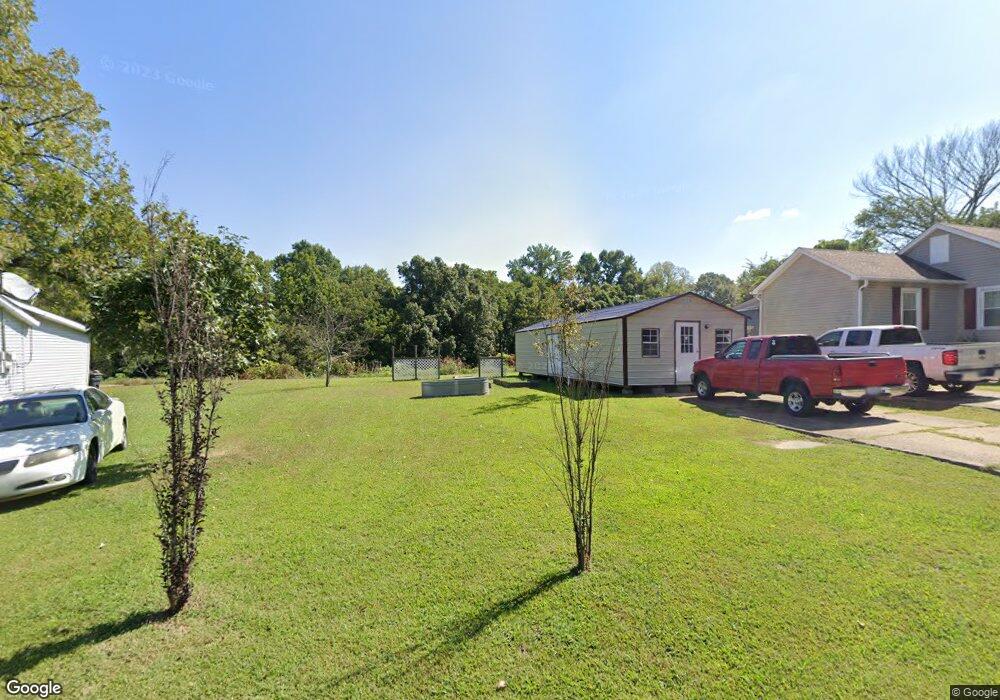
123 Pennington St Ripley, TN 38063
Estimated Value: $64,000 - $121,000
--
Bed
1
Bath
--
Sq Ft
5,663
Sq Ft Lot
About This Home
This home is located at 123 Pennington St, Ripley, TN 38063 and is currently estimated at $89,289. 123 Pennington St is a home located in Lauderdale County with nearby schools including Ripley Primary School, Ripley Elementary School, and Ripley Middle School.
Ownership History
Date
Name
Owned For
Owner Type
Purchase Details
Closed on
Jan 25, 2012
Sold by
Drumwright Dennis W
Bought by
Glass James Gordon
Current Estimated Value
Purchase Details
Closed on
Nov 18, 2011
Sold by
Drumwright Amanda
Bought by
Drumwright Dennis
Purchase Details
Closed on
Jan 10, 2005
Sold by
Latham Evelyn J
Bought by
Drumwright Dennis W
Purchase Details
Closed on
Aug 26, 2004
Sold by
Personal Finance
Bought by
Latham Evelyn J
Purchase Details
Closed on
Mar 8, 2004
Bought by
Younger Latham Evelyn J % Manson
Purchase Details
Closed on
Sep 25, 2002
Sold by
Taylor Claudia & Sub Trust
Bought by
Personal Finance Corp
Purchase Details
Closed on
May 26, 2000
Sold by
Personal Finance Corp
Bought by
Claudia Taylor
Purchase Details
Closed on
May 24, 2000
Bought by
Taylor Claudia
Purchase Details
Closed on
Dec 14, 1999
Sold by
Clyde Wright
Bought by
Personal Finance
Purchase Details
Closed on
Sep 22, 1987
Bought by
Wright Clyde
Purchase Details
Closed on
Nov 17, 1986
Bought by
Wright Clyde and Sanders Tyrus
Purchase Details
Closed on
Oct 28, 1955
Create a Home Valuation Report for This Property
The Home Valuation Report is an in-depth analysis detailing your home's value as well as a comparison with similar homes in the area
Home Values in the Area
Average Home Value in this Area
Purchase History
| Date | Buyer | Sale Price | Title Company |
|---|---|---|---|
| Glass James Gordon | $5,000 | -- | |
| Drumwright Dennis | -- | -- | |
| Drumwright Dennis W | $5,000 | -- | |
| Latham Evelyn J | $5,500 | -- | |
| Younger Latham Evelyn J % Manson | $5,500 | -- | |
| Personal Finance Corp | $20,000 | -- | |
| Claudia Taylor | $24,056 | -- | |
| Taylor Claudia | $24,100 | -- | |
| Personal Finance | $28,823 | -- | |
| Wright Clyde | -- | -- | |
| Wright Clyde | -- | -- | |
| -- | -- | -- |
Source: Public Records
Tax History Compared to Growth
Tax History
| Year | Tax Paid | Tax Assessment Tax Assessment Total Assessment is a certain percentage of the fair market value that is determined by local assessors to be the total taxable value of land and additions on the property. | Land | Improvement |
|---|---|---|---|---|
| 2024 | $81 | $3,200 | $500 | $2,700 |
| 2023 | $161 | $3,200 | $500 | $2,700 |
| 2022 | $26 | $500 | $500 | $0 |
| 2021 | $24 | $500 | $500 | $0 |
| 2020 | $34 | $500 | $500 | $0 |
| 2019 | $34 | $625 | $625 | $0 |
| 2018 | $34 | $625 | $625 | $0 |
| 2017 | $34 | $625 | $625 | $0 |
| 2016 | $33 | $625 | $625 | $0 |
| 2015 | $30 | $625 | $625 | $0 |
| 2014 | $18 | $625 | $625 | $0 |
Source: Public Records
Map
Nearby Homes
- 154 S Main St
- 114 S Jefferson St
- 127 Jackson St
- 0 Monroe St
- 000 Monroe St
- 0 Lake Dr Unit 242610
- 0 Cleveland St
- 229 N Main St
- 141 Tucker Ave
- 143 Lake Dr
- 273 N Main St
- 189 Church St
- 140 Center St
- 227 S Jefferson St
- 307 Eastland Ave
- 242 Lackey Ln
- 150 Westwood Cir
- 0 Eastland Ave
- 115 Westwood Cove
- 132 Skyline Dr
- 119 Pennington St
- 125 Pennington St
- 127 Pennington St
- 120 Pennington St
- 124 Pennington St
- 128 Pennington St
- 130 Pennington St
- 175 Eastend St
- 181 Eastend St
- 163 Eastend St
- 185 Eastend St
- 167 Eastend St
- 170 Eastend St
- 174 Eastend St
- 168 Eastend St
- 159 Eastend St
- 164 Eastend St
- 162 Eastend St
- 158 Eastend St
- 180 Eastend St