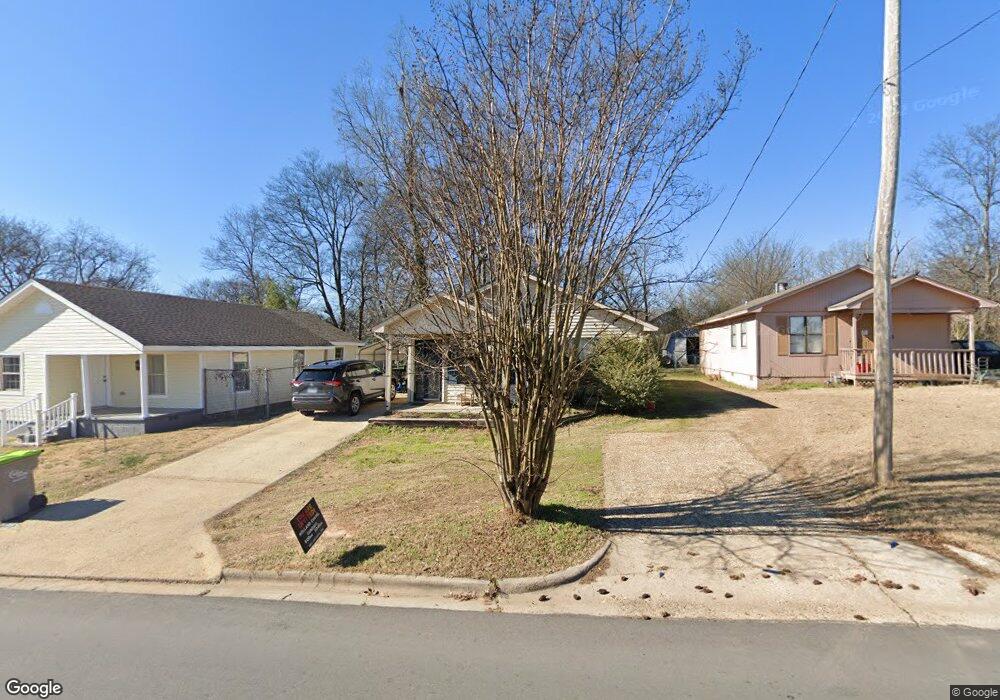
123 S 4th Benton, AR 72015
Estimated Value: $119,761 - $163,000
2
Beds
1
Bath
900
Sq Ft
$150/Sq Ft
Est. Value
About This Home
This home is located at 123 S 4th, Benton, AR 72015 and is currently estimated at $135,190, approximately $150 per square foot. 123 S 4th is a home located in Saline County with nearby schools including Angie Grant Elementary School, Benton Middle School, and Benton Junior High School.
Ownership History
Date
Name
Owned For
Owner Type
Purchase Details
Closed on
Aug 31, 2018
Sold by
Brown Cathy C
Bought by
Brown Hillary and Brown Caleb
Current Estimated Value
Home Financials for this Owner
Home Financials are based on the most recent Mortgage that was taken out on this home.
Original Mortgage
$67,900
Outstanding Balance
$59,097
Interest Rate
4.6%
Mortgage Type
New Conventional
Estimated Equity
$76,093
Purchase Details
Closed on
Oct 1, 2013
Sold by
Johnson Mary K and Johnson Mary K
Bought by
Brown Cathy C
Purchase Details
Closed on
Feb 1, 2005
Sold by
Thomas Mary K
Bought by
Thomas Mary K
Purchase Details
Closed on
Jan 19, 1995
Bought by
Thomas
Purchase Details
Closed on
Jan 2, 1991
Bought by
Whatley
Purchase Details
Closed on
Feb 1, 1990
Bought by
Cole
Create a Home Valuation Report for This Property
The Home Valuation Report is an in-depth analysis detailing your home's value as well as a comparison with similar homes in the area
Home Values in the Area
Average Home Value in this Area
Purchase History
| Date | Buyer | Sale Price | Title Company |
|---|---|---|---|
| Brown Hillary | $70,000 | Lenders Title Company | |
| Brown Cathy C | -- | None Available | |
| Thomas Mary K | -- | -- | |
| Thomas | $50,000 | -- | |
| Whatley | $44,000 | -- | |
| Cole | $5,000 | -- |
Source: Public Records
Mortgage History
| Date | Status | Borrower | Loan Amount |
|---|---|---|---|
| Open | Brown Hillary | $67,900 |
Source: Public Records
Tax History Compared to Growth
Tax History
| Year | Tax Paid | Tax Assessment Tax Assessment Total Assessment is a certain percentage of the fair market value that is determined by local assessors to be the total taxable value of land and additions on the property. | Land | Improvement |
|---|---|---|---|---|
| 2025 | $767 | $16,768 | $1,200 | $15,568 |
| 2024 | $785 | $16,768 | $1,200 | $15,568 |
| 2023 | $309 | $16,768 | $1,200 | $15,568 |
| 2022 | $325 | $16,768 | $1,200 | $15,568 |
| 2021 | $292 | $12,040 | $1,000 | $11,040 |
| 2020 | $292 | $12,040 | $1,000 | $11,040 |
| 2019 | $292 | $12,040 | $1,000 | $11,040 |
| 2018 | $316 | $12,040 | $1,000 | $11,040 |
| 2017 | $666 | $12,040 | $1,000 | $11,040 |
| 2016 | $696 | $12,280 | $1,000 | $11,280 |
| 2015 | $689 | $12,280 | $1,000 | $11,280 |
| 2014 | $689 | $12,280 | $1,000 | $11,280 |
Source: Public Records
Map
Nearby Homes