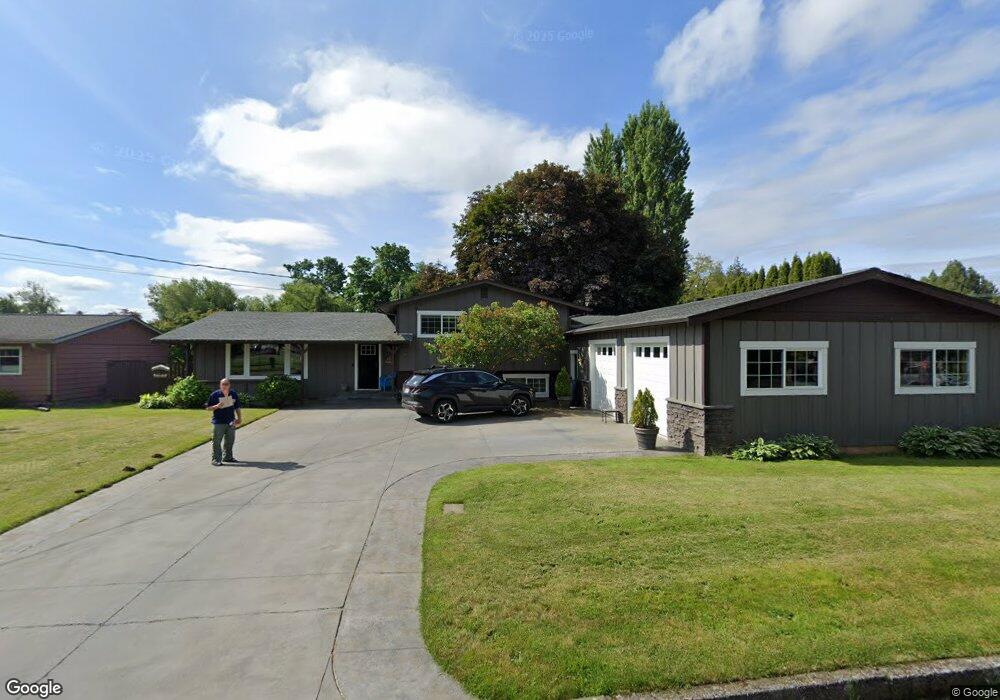
123 S Meadow Ln Lynden, WA 98264
Estimated Value: $594,000 - $770,000
4
Beds
3
Baths
2,070
Sq Ft
$339/Sq Ft
Est. Value
About This Home
This home is located at 123 S Meadow Ln, Lynden, WA 98264 and is currently estimated at $701,866, approximately $339 per square foot. 123 S Meadow Ln is a home located in Whatcom County with nearby schools including Lynden High School, Lynden Christian School, and Lynden Christian Schools: Administration.
Ownership History
Date
Name
Owned For
Owner Type
Purchase Details
Closed on
Jul 18, 2017
Sold by
Molendyk Michael D and Molendyk Kristi L
Bought by
Marsh Gregory and Marsh April
Current Estimated Value
Home Financials for this Owner
Home Financials are based on the most recent Mortgage that was taken out on this home.
Original Mortgage
$250,000
Outstanding Balance
$207,708
Interest Rate
3.89%
Mortgage Type
New Conventional
Estimated Equity
$494,158
Purchase Details
Closed on
Oct 26, 1999
Sold by
Norwest Bank Minnesota Na
Bought by
Molendyk Michael D and Molendyk Kristi L
Home Financials for this Owner
Home Financials are based on the most recent Mortgage that was taken out on this home.
Original Mortgage
$108,400
Interest Rate
7.75%
Purchase Details
Closed on
Jul 29, 1999
Sold by
Floto David F and Floto Barbara J
Bought by
Norwest Bank Minnesota Na
Create a Home Valuation Report for This Property
The Home Valuation Report is an in-depth analysis detailing your home's value as well as a comparison with similar homes in the area
Home Values in the Area
Average Home Value in this Area
Purchase History
| Date | Buyer | Sale Price | Title Company |
|---|---|---|---|
| Marsh Gregory | $420,000 | Whatcom Land Title Co Inc | |
| Molendyk Michael D | $135,500 | Whatcom Land Title | |
| Norwest Bank Minnesota Na | $129,112 | Island Title Company |
Source: Public Records
Mortgage History
| Date | Status | Borrower | Loan Amount |
|---|---|---|---|
| Open | Marsh Gregory | $250,000 | |
| Previous Owner | Molendyk Michael D | $108,400 |
Source: Public Records
Tax History Compared to Growth
Tax History
| Year | Tax Paid | Tax Assessment Tax Assessment Total Assessment is a certain percentage of the fair market value that is determined by local assessors to be the total taxable value of land and additions on the property. | Land | Improvement |
|---|---|---|---|---|
| 2024 | $4,437 | $621,454 | $291,000 | $330,454 |
| 2023 | $4,437 | $617,744 | $300,000 | $317,744 |
| 2022 | $3,537 | $464,643 | $118,685 | $345,958 |
| 2021 | $3,470 | $383,998 | $98,086 | $285,912 |
| 2020 | $3,039 | $342,865 | $87,579 | $255,286 |
| 2019 | $2,704 | $314,424 | $80,412 | $234,012 |
| 2018 | $2,955 | $286,776 | $73,252 | $213,524 |
| 2017 | $2,626 | $257,406 | $65,750 | $191,656 |
| 2016 | $2,473 | $243,287 | $60,500 | $182,787 |
| 2015 | $2,192 | $227,938 | $58,190 | $169,748 |
| 2014 | -- | $220,218 | $56,210 | $164,008 |
| 2013 | -- | $219,008 | $55,000 | $164,008 |
Source: Public Records
Map
Nearby Homes
- 8374 W Meadow Ln
- 2 Guide Meridian Rd
- 801 19th St
- 605 N Forest Ct
- 2010 Front St Unit 33
- 1882 Front St Unit B208
- 1882 Front St Unit B111
- 106 Fairside Dr Unit D
- 515 17th St
- 403 17th St
- 210 Stremler Dr
- 1717 E St
- 1420 Birch Bay Lynden Rd
- 1440 Birch Bay Lynden Rd
- 1584 Main St
- 1774 Farmview Terrace
- 197 Bay Lyn Dr
- 1510 E St
- 314 S 16th St
- 1710 Farmview Terrace
- 124 S Meadow Ln
- 131 S Meadow Ln
- 8358 W Meadow Ln
- 139 S Meadow Ln
- 8365 Meadow Ln
- 8364 W Meadow Ln
- 8358 Meadow Ln
- 8371 Meadow Ln
- 141 Wood Creek Dr
- 8364 Meadow Ln
- 8372 W Meadow Ln
- 8370 Meadow Ln
- 8377 Meadow Ln
- 701 Woodview Ct
- 143 Wood Creek Dr
- 703 Woodview Ct
- 506 Forest Cir Unit 3C
- 506 Forest Cir Unit 3B
- 506 Forest Cir Unit 3A
- 8376 Meadow Ln