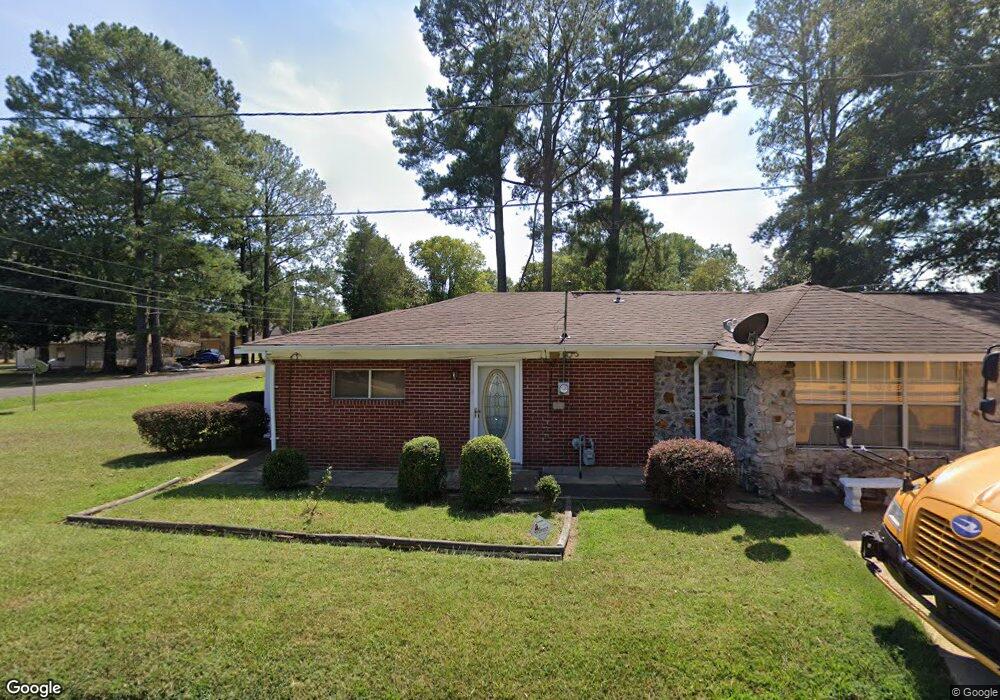
123 Thurmond Rd Lexington, MS 39095
Estimated Value: $93,786 - $221,000
3
Beds
--
Bath
2,113
Sq Ft
$81/Sq Ft
Est. Value
About This Home
This home is located at 123 Thurmond Rd, Lexington, MS 39095 and is currently estimated at $170,947, approximately $80 per square foot. 123 Thurmond Rd is a home with nearby schools including William Dean Jr. Elementary School, S.V. Marshall Elementary School, and Durant Elementary School.
Create a Home Valuation Report for This Property
The Home Valuation Report is an in-depth analysis detailing your home's value as well as a comparison with similar homes in the area
Home Values in the Area
Average Home Value in this Area
Tax History Compared to Growth
Tax History
| Year | Tax Paid | Tax Assessment Tax Assessment Total Assessment is a certain percentage of the fair market value that is determined by local assessors to be the total taxable value of land and additions on the property. | Land | Improvement |
|---|---|---|---|---|
| 2024 | $1,462 | $9,987 | $750 | $9,237 |
| 2023 | $1,462 | $9,987 | $750 | $9,237 |
| 2022 | $1,281 | $8,750 | $750 | $8,000 |
| 2021 | $1,257 | $8,750 | $750 | $8,000 |
| 2020 | $1,353 | $9,417 | $750 | $8,667 |
| 2019 | $1,353 | $9,417 | $750 | $8,667 |
| 2018 | $833 | $5,801 | $500 | $5,301 |
| 2017 | -- | $5,801 | $500 | $5,301 |
| 2016 | -- | $5,801 | $500 | $5,301 |
| 2015 | -- | $5,748 | $500 | $5,248 |
| 2013 | -- | $5,503 | $500 | $5,003 |
Source: Public Records
Map
Nearby Homes
- 169 Edwards St
- N/A Westwood Ave
- 0 Highway 17 Unit 4097317
- 417 Boulevard St
- 0 Mississippi 12
- 14514 Mississippi 17
- 110 Old Tchula Rd
- 16844 Mississippi 12
- 2 Rockport Rd
- 1 Rockport Rd
- 700 Rathell Rd
- + - 37 Acres Unit Holmes County MS
- + - 58 Acres Unit Holmes County MS
- 24929 Mississippi 12
- 24927 Ms-12
- 106 Crockrell Rd
- 3295 Sand Hill Rd
- 0 Springhill Rd
- 0 Pea Ridge Rd Unit 24988716
- 0 Pea Ridge Rd Unit 4127413