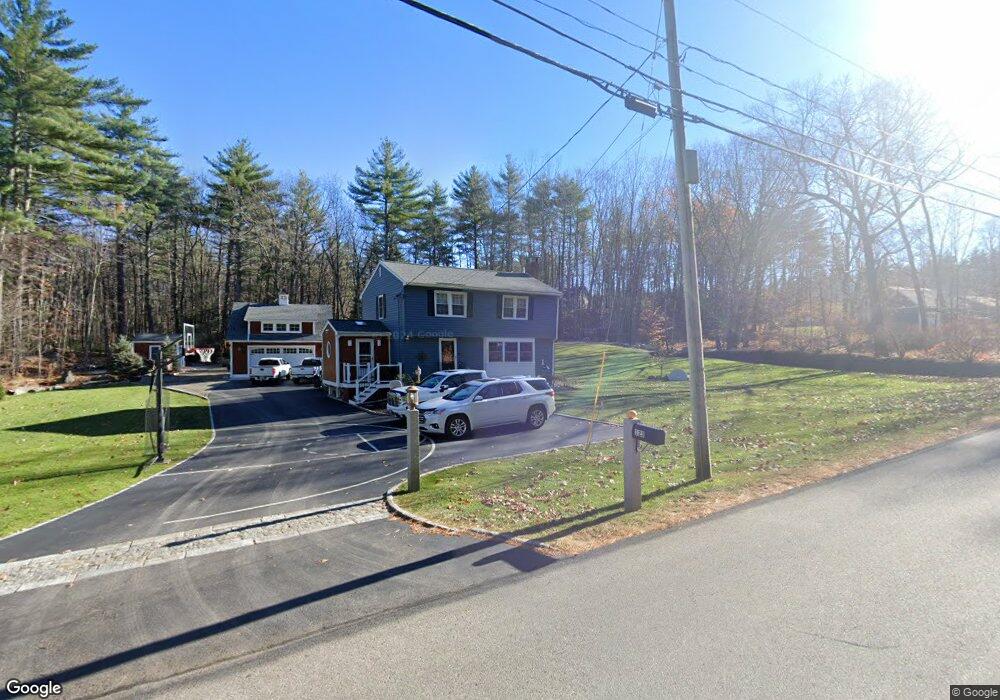
123 Watson Rd Exeter, NH 03833
Estimated Value: $587,000 - $714,000
4
Beds
2
Baths
1,563
Sq Ft
$417/Sq Ft
Est. Value
About This Home
This home is located at 123 Watson Rd, Exeter, NH 03833 and is currently estimated at $651,831, approximately $417 per square foot. 123 Watson Rd is a home located in Rockingham County with nearby schools including Main Street School, Lincoln Street Elementary School, and Cooperative Middle School.
Ownership History
Date
Name
Owned For
Owner Type
Purchase Details
Closed on
Apr 10, 2012
Sold by
Obrien Eric T and Martin-Obrien Alexandra
Bought by
Lyons John P and Lyons Tiffani E
Current Estimated Value
Purchase Details
Closed on
Jun 26, 2006
Sold by
Komusin Robert
Bought by
Obrien Alexandra Marti and Obrien Eric T
Home Financials for this Owner
Home Financials are based on the most recent Mortgage that was taken out on this home.
Original Mortgage
$246,960
Interest Rate
6.59%
Mortgage Type
Purchase Money Mortgage
Purchase Details
Closed on
Feb 23, 1996
Sold by
Snow Joseph W and Snow Evelyn M
Bought by
Komusin Robert and Komusin Karen
Home Financials for this Owner
Home Financials are based on the most recent Mortgage that was taken out on this home.
Original Mortgage
$115,133
Interest Rate
7.04%
Create a Home Valuation Report for This Property
The Home Valuation Report is an in-depth analysis detailing your home's value as well as a comparison with similar homes in the area
Home Values in the Area
Average Home Value in this Area
Purchase History
| Date | Buyer | Sale Price | Title Company |
|---|---|---|---|
| Lyons John P | $201,000 | -- | |
| Lyons John P | $201,000 | -- | |
| Obrien Alexandra Marti | $308,700 | -- | |
| Obrien Alexandra Marti | $308,700 | -- | |
| Komusin Robert | $118,000 | -- | |
| Komusin Robert | $118,000 | -- |
Source: Public Records
Mortgage History
| Date | Status | Borrower | Loan Amount |
|---|---|---|---|
| Previous Owner | Komusin Robert | $246,960 | |
| Previous Owner | Komusin Robert | $115,133 |
Source: Public Records
Tax History
| Year | Tax Paid | Tax Assessment Tax Assessment Total Assessment is a certain percentage of the fair market value that is determined by local assessors to be the total taxable value of land and additions on the property. | Land | Improvement |
|---|---|---|---|---|
| 2025 | $10,205 | $544,000 | $277,900 | $266,100 |
| 2024 | $9,678 | $544,000 | $277,900 | $266,100 |
| 2023 | $9,459 | $353,200 | $163,400 | $189,800 |
| 2022 | $8,742 | $353,200 | $163,400 | $189,800 |
| 2021 | $8,082 | $336,600 | $163,400 | $173,200 |
| 2020 | $7,820 | $319,300 | $163,400 | $155,900 |
| 2019 | $4,851 | $319,300 | $163,400 | $155,900 |
| 2018 | $7,216 | $262,400 | $120,200 | $142,200 |
| 2017 | $271 | $260,700 | $120,200 | $140,500 |
| 2016 | $6,841 | $260,700 | $120,200 | $140,500 |
| 2015 | $6,658 | $260,700 | $120,200 | $140,500 |
| 2014 | $6,463 | $248,000 | $120,200 | $127,800 |
| 2013 | $6,455 | $248,000 | $120,200 | $127,800 |
| 2011 | $6,269 | $248,000 | $120,200 | $127,800 |
Source: Public Records
Map
Nearby Homes
- 5 Stone Ridge Ln
- 20 Beech Hill Rd Unit 11
- 00 Piscassic & Oaklands Rd Unit 1
- 5 Ridge Rd
- 104 Piscassic Rd
- 9 Captain's Way
- 28 Partridge Hill Rd
- 7 Willey Creek Rd Unit 405
- 120 Exeter Rd
- 100 Exeter Rd
- 7 Chapman Way
- 3 Swamscott St
- 10 Wingate Ct
- 0 Autumn Ln
- 14 Garrison Ln
- 5 Brookside Dr Unit 9
- 4 Brookside Dr Unit 10
- 50 Brookside Dr Unit 7
- 50 Brookside Dr Unit F2
- 18 Little River Rd Unit LOT 3
Your Personal Tour Guide
Ask me questions while you tour the home.