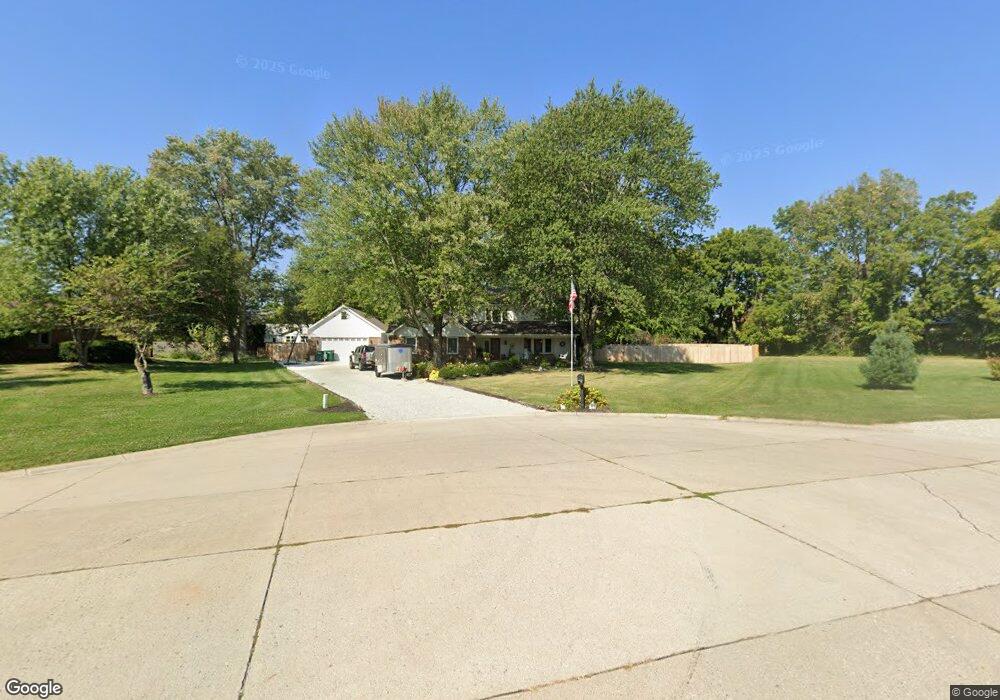
1230 Bokeelia Bend Westfield, IN 46074
Estimated Value: $334,000 - $541,000
3
Beds
3
Baths
2,017
Sq Ft
$203/Sq Ft
Est. Value
About This Home
This home is located at 1230 Bokeelia Bend, Westfield, IN 46074 and is currently estimated at $409,401, approximately $202 per square foot. 1230 Bokeelia Bend is a home located in Hamilton County with nearby schools including Monon Trail Elementary School, Westfield Intermediate School, and Westfield Middle School.
Ownership History
Date
Name
Owned For
Owner Type
Purchase Details
Closed on
Nov 5, 2009
Sold by
Grace Enterprises
Bought by
Rigdon Christy L
Current Estimated Value
Home Financials for this Owner
Home Financials are based on the most recent Mortgage that was taken out on this home.
Original Mortgage
$142,373
Outstanding Balance
$90,196
Interest Rate
4.9%
Mortgage Type
FHA
Estimated Equity
$319,205
Purchase Details
Closed on
Aug 27, 2009
Sold by
Stephanoff Michael G
Bought by
Grace Enterprises
Purchase Details
Closed on
May 6, 2005
Sold by
Walters Stephanie L
Bought by
Stephanoff Michael G
Home Financials for this Owner
Home Financials are based on the most recent Mortgage that was taken out on this home.
Original Mortgage
$170,000
Interest Rate
7.1%
Mortgage Type
Fannie Mae Freddie Mac
Create a Home Valuation Report for This Property
The Home Valuation Report is an in-depth analysis detailing your home's value as well as a comparison with similar homes in the area
Home Values in the Area
Average Home Value in this Area
Purchase History
| Date | Buyer | Sale Price | Title Company |
|---|---|---|---|
| Rigdon Christy L | -- | None Available | |
| Grace Enterprises | $104,800 | None Available | |
| Stephanoff Michael G | -- | Midwest Title Corporation |
Source: Public Records
Mortgage History
| Date | Status | Borrower | Loan Amount |
|---|---|---|---|
| Open | Rigdon Christy L | $142,373 | |
| Previous Owner | Stephanoff Michael G | $170,000 |
Source: Public Records
Tax History
| Year | Tax Paid | Tax Assessment Tax Assessment Total Assessment is a certain percentage of the fair market value that is determined by local assessors to be the total taxable value of land and additions on the property. | Land | Improvement |
|---|---|---|---|---|
| 2024 | $2,993 | $265,100 | $46,100 | $219,000 |
| 2023 | $2,808 | $246,500 | $46,100 | $200,400 |
| 2022 | $2,566 | $223,300 | $46,100 | $177,200 |
| 2021 | $2,323 | $197,600 | $46,100 | $151,500 |
| 2020 | $2,185 | $184,800 | $46,100 | $138,700 |
| 2019 | $2,341 | $197,400 | $25,600 | $171,800 |
| 2018 | $2,260 | $189,000 | $25,600 | $163,400 |
| 2017 | $2,021 | $181,200 | $25,600 | $155,600 |
| 2016 | $1,971 | $176,900 | $25,600 | $151,300 |
| 2014 | $1,877 | $168,600 | $25,600 | $143,000 |
| 2013 | $1,877 | $164,500 | $25,600 | $138,900 |
Source: Public Records
Map
Nearby Homes
- 1439 Chatham Hills Blvd
- 1545 Hamilton Ridge Rd
- 19742 Chatham Shore Ln
- 1563 Hamilton Ridge Rd
- 1575 Hamilton Ridge Rd
- 19770 Chatham Shore Ln
- 1581 Hamilton Ridge Rd
- 19784 Chatham Shore Ln
- 19837 Chatham Shore Ln
- 0 E 191st St Unit MBR22041251
- 19816 Chatsworth Blvd
- 19832 Chatsworth Blvd
- 1424 Chatham Hills Blvd
- 19525 Wood Farm Place
- 803 James William Ln
- 804 Possman Way
- 797 James William Ln
- 785 James William Ln
- 773 James William Ln
- 767 James William Ln
- 1232 Bokeelia Bend
- 19319 Tomlinson Rd
- 1220 Bokeelia Bend
- 19301 Tomlinson Rd
- 1231 Bokeelia Bend
- 1229 Bokeelia Bend
- 19231 Tomlinson Rd
- 19345 Tomlinson Rd
- 1221 Bokeelia Bend
- 1225 Bokeelia Bend
- 1217 Bokeelia Bend
- 0 Tomlinson Rd
- 0 Tomlinson Rd Unit MBR21270686
- 1215 Bokeelia Bend
- 1223 Bokeelia Bend
- 1207 Bokeelia Bend
- 1222 E 191st St
- 19150 Tomlinson Rd
- 19145 Tomlinson Rd
- 19109 Tomlinson Rd
Your Personal Tour Guide
Ask me questions while you tour the home.