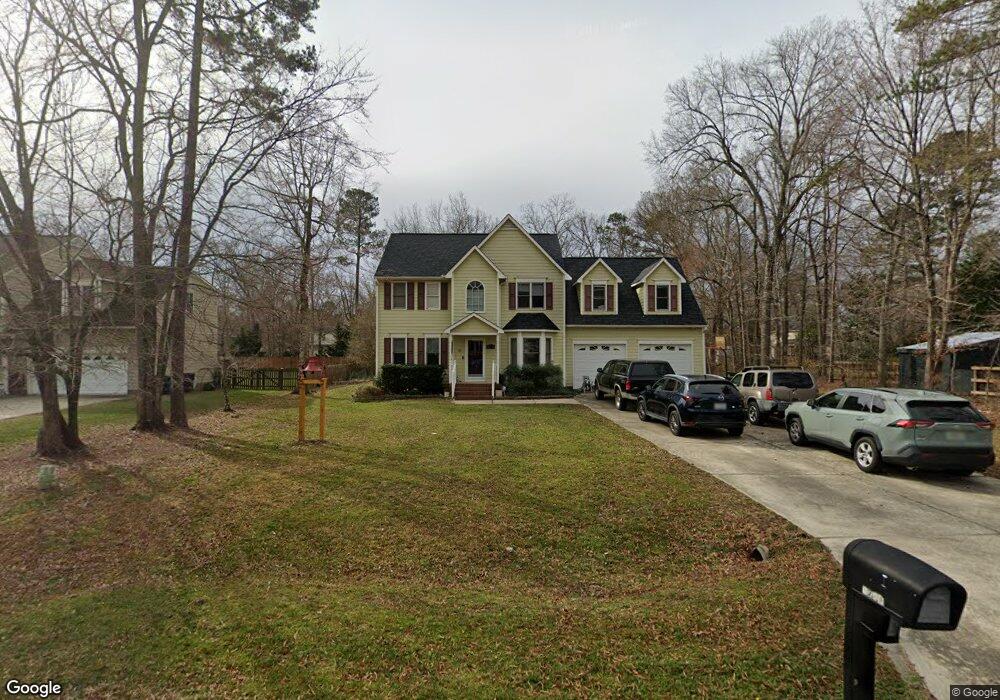
1230 Briardale Ln Durham, NC 27712
Estimated Value: $473,793 - $499,000
5
Beds
3
Baths
2,263
Sq Ft
$214/Sq Ft
Est. Value
About This Home
This home is located at 1230 Briardale Ln, Durham, NC 27712 and is currently estimated at $483,698, approximately $213 per square foot. 1230 Briardale Ln is a home located in Durham County with nearby schools including Eno Valley Elementary, George L Carrington Middle, and Northern High School.
Ownership History
Date
Name
Owned For
Owner Type
Purchase Details
Closed on
Nov 20, 2008
Sold by
Equity One Inc
Bought by
Alarcon Javier
Current Estimated Value
Purchase Details
Closed on
Sep 23, 2008
Sold by
Nieves Elizabeth R and Nieves Diego E
Bought by
Equity One Inc
Purchase Details
Closed on
May 1, 2006
Sold by
Va
Bought by
Nieves Elizabeth R and Rios Diego E Nieves
Home Financials for this Owner
Home Financials are based on the most recent Mortgage that was taken out on this home.
Original Mortgage
$153,400
Interest Rate
7.87%
Mortgage Type
Fannie Mae Freddie Mac
Purchase Details
Closed on
Jun 14, 2005
Sold by
Johnson Juan A and Johnson Cynthia D
Bought by
Va
Purchase Details
Closed on
Nov 27, 2000
Sold by
Dodd E Maxine R and E Maxine R
Bought by
Johnson Juan and Johnson Cynthia
Home Financials for this Owner
Home Financials are based on the most recent Mortgage that was taken out on this home.
Original Mortgage
$203,000
Interest Rate
7.79%
Mortgage Type
VA
Create a Home Valuation Report for This Property
The Home Valuation Report is an in-depth analysis detailing your home's value as well as a comparison with similar homes in the area
Home Values in the Area
Average Home Value in this Area
Purchase History
| Date | Buyer | Sale Price | Title Company |
|---|---|---|---|
| Alarcon Javier | $189,000 | None Available | |
| Equity One Inc | $189,600 | None Available | |
| Nieves Elizabeth R | -- | None Available | |
| Va | $176,260 | -- | |
| Johnson Juan | $199,500 | -- |
Source: Public Records
Mortgage History
| Date | Status | Borrower | Loan Amount |
|---|---|---|---|
| Previous Owner | Nieves Elizabeth R | $153,400 | |
| Previous Owner | Johnson Juan | $203,000 |
Source: Public Records
Tax History Compared to Growth
Tax History
| Year | Tax Paid | Tax Assessment Tax Assessment Total Assessment is a certain percentage of the fair market value that is determined by local assessors to be the total taxable value of land and additions on the property. | Land | Improvement |
|---|---|---|---|---|
| 2025 | $3,380 | $421,248 | $84,525 | $336,723 |
| 2024 | $3,380 | $242,308 | $44,160 | $198,148 |
| 2023 | $3,174 | $242,308 | $44,160 | $198,148 |
| 2022 | $3,101 | $242,308 | $44,160 | $198,148 |
| 2021 | $3,087 | $242,308 | $44,160 | $198,148 |
| 2020 | $3,014 | $242,308 | $44,160 | $198,148 |
| 2019 | $3,014 | $242,308 | $44,160 | $198,148 |
| 2018 | $2,784 | $205,221 | $40,480 | $164,741 |
| 2017 | $2,763 | $205,221 | $40,480 | $164,741 |
| 2016 | $2,670 | $205,221 | $40,480 | $164,741 |
| 2015 | $2,968 | $214,424 | $45,375 | $169,049 |
| 2014 | $2,968 | $214,424 | $45,375 | $169,049 |
Source: Public Records
Map
Nearby Homes
- 3 Berg Place
- 5612 Stardust Dr
- 631 Infinity Rd
- 6 Bluffside Ct
- 4806 Seterra Bend
- 19 Pedestal Rock Ln
- 4815 Lazyriver Dr
- 4108 Lazyriver Ln
- 4803 Lazyriver Dr
- 4717 Buttonbush Dr
- 1 Warbler Ln
- 4319 White Cliff Ln
- 512 Crestview Dr
- 605 Infinity Rd
- 404 Goodwin Rd
- 1318 Torredge Rd
- 1617 Torredge Rd
- 5500 Novaglen Rd
- 4400 Lazyriver Dr
- 5617 Laurel Crest Dr
- 1234 Briardale Ln
- 1312 Shady Ln
- 1308 Shady Ln
- 1230 Briardale Rd
- 1304 Shady Ln
- 1231 Briardale Ln
- 1227 Briardale Ln
- 1223 Briardale Ln
- 1227 Briardale Rd
- 1234 Briardale Rd
- 1234 Briardale Rd
- 1223 Briardale Rd
- 1227 Briardale Rd
- 1303 Meadston Dr
- 1219 Briardale Rd
- 1301 Meadston Dr
- 1231 Briardale Rd
- 1309 Shady Ln
- 1305 Meadston Dr
- 1300 Briardale Ln