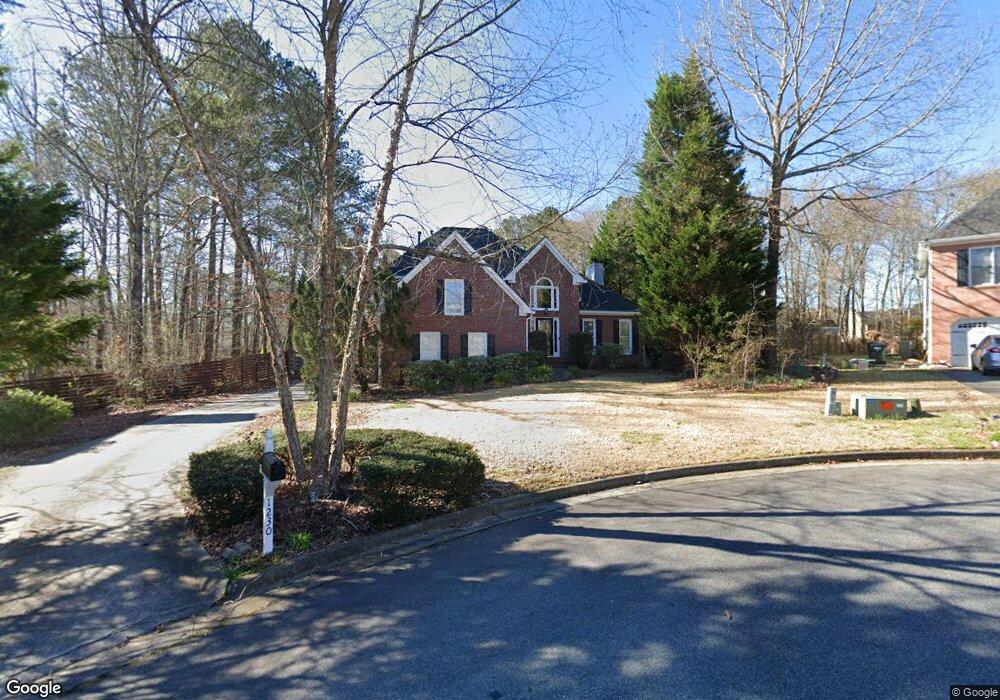
1230 Commonwealth Ave SW Marietta, GA 30064
West Cobb NeighborhoodEstimated Value: $506,435 - $601,000
4
Beds
3
Baths
2,283
Sq Ft
$241/Sq Ft
Est. Value
About This Home
This home is located at 1230 Commonwealth Ave SW, Marietta, GA 30064 and is currently estimated at $549,359, approximately $240 per square foot. 1230 Commonwealth Ave SW is a home located in Cobb County with nearby schools including Still Elementary School, Lovinggood Middle School, and Hillgrove High School.
Ownership History
Date
Name
Owned For
Owner Type
Purchase Details
Closed on
Nov 30, 2009
Sold by
Jms Marketing Llc
Bought by
Cressy Sean M and Cressy Stacye A
Current Estimated Value
Home Financials for this Owner
Home Financials are based on the most recent Mortgage that was taken out on this home.
Original Mortgage
$216,132
Outstanding Balance
$140,981
Interest Rate
4.98%
Mortgage Type
FHA
Estimated Equity
$408,378
Purchase Details
Closed on
Jun 17, 2009
Sold by
Cit Trust 2007-1
Bought by
Jms Marketing Llc
Purchase Details
Closed on
May 12, 2009
Sold by
Chambers Christine A
Bought by
Bank Of Ny Of Mellon
Purchase Details
Closed on
Apr 22, 1997
Sold by
Circle W Constraction
Bought by
Chambers Calvin and Chambers Christine
Home Financials for this Owner
Home Financials are based on the most recent Mortgage that was taken out on this home.
Original Mortgage
$174,800
Interest Rate
7.5%
Mortgage Type
New Conventional
Create a Home Valuation Report for This Property
The Home Valuation Report is an in-depth analysis detailing your home's value as well as a comparison with similar homes in the area
Home Values in the Area
Average Home Value in this Area
Purchase History
| Date | Buyer | Sale Price | Title Company |
|---|---|---|---|
| Cressy Sean M | $249,900 | -- | |
| Jms Marketing Llc | $145,000 | -- | |
| Bank Of Ny Of Mellon | $120,584 | -- | |
| Chambers Calvin | $184,100 | -- |
Source: Public Records
Mortgage History
| Date | Status | Borrower | Loan Amount |
|---|---|---|---|
| Open | Cressy Sean M | $216,132 | |
| Previous Owner | Chambers Calvin | $174,800 |
Source: Public Records
Tax History Compared to Growth
Tax History
| Year | Tax Paid | Tax Assessment Tax Assessment Total Assessment is a certain percentage of the fair market value that is determined by local assessors to be the total taxable value of land and additions on the property. | Land | Improvement |
|---|---|---|---|---|
| 2025 | $5,757 | $232,000 | $44,000 | $188,000 |
| 2024 | $5,762 | $232,000 | $44,000 | $188,000 |
| 2023 | $4,076 | $179,312 | $26,000 | $153,312 |
| 2022 | $4,653 | $179,312 | $26,000 | $153,312 |
| 2021 | $3,797 | $140,236 | $26,000 | $114,236 |
| 2020 | $3,486 | $126,012 | $24,000 | $102,012 |
| 2019 | $3,486 | $126,012 | $24,000 | $102,012 |
| 2018 | $3,486 | $126,012 | $24,000 | $102,012 |
| 2017 | $3,314 | $126,012 | $24,000 | $102,012 |
| 2016 | $3,056 | $115,184 | $24,000 | $91,184 |
| 2015 | $2,455 | $92,176 | $23,800 | $68,376 |
| 2014 | $2,476 | $92,176 | $0 | $0 |
Source: Public Records
Map
Nearby Homes
- 1204 Commonwealth Ave SW
- 719 Crossroad SW
- 1567 Vine Leaf Dr
- 3416 N Cook Rd
- 1524 Jade Cove Dr
- 3006 Coffman Ct SW
- 1765 Dew Place
- 1649 Kimble Dr SW
- 2866 Wynford Dr SW Unit 2
- 3458 Velma Dr
- 1234 Wynford Colony SW
- 3454 Velma Dr
- 0 Friendship Church Rd SW Unit 10510111
- 0 Friendship Church Rd SW Unit 7569463
- 3061 Hallman Cir SW
- 1518 Sage Ridge Dr
- 1237 Wynford Woods SW
- 3354 Hannah Ct
- 3003 Lawson Dr
- 950 Steadman Terrace SW
- 1228 Commonwealth Ave SW Unit 2
- 1232 Commonwealth Ave SW
- 1226 Commonwealth Ave SW
- 1445 Wiltshire Cir
- 1234 Commonwealth Ave SW
- 3392 Chatsworth Way
- 1229 Commonwealth Ave SW Unit 42
- 1229 Commonwealth Ave SW
- 1444 Wiltshire Cir
- 3394 Chatsworth Way
- 3394 Chatsworth Way
- 1224 Commonwealth Ave SW
- 1447 Wiltshire Cir
- 3390 Chatsworth Way
- 1236 Commonwealth Ave SW
- 1222 Commonwealth Ave SW Unit 2
- 3396 Chatsworth Way
- 3388 Chatsworth Way
- 1223 Commonwealth Ave SW
- 3386 Chatsworth Way