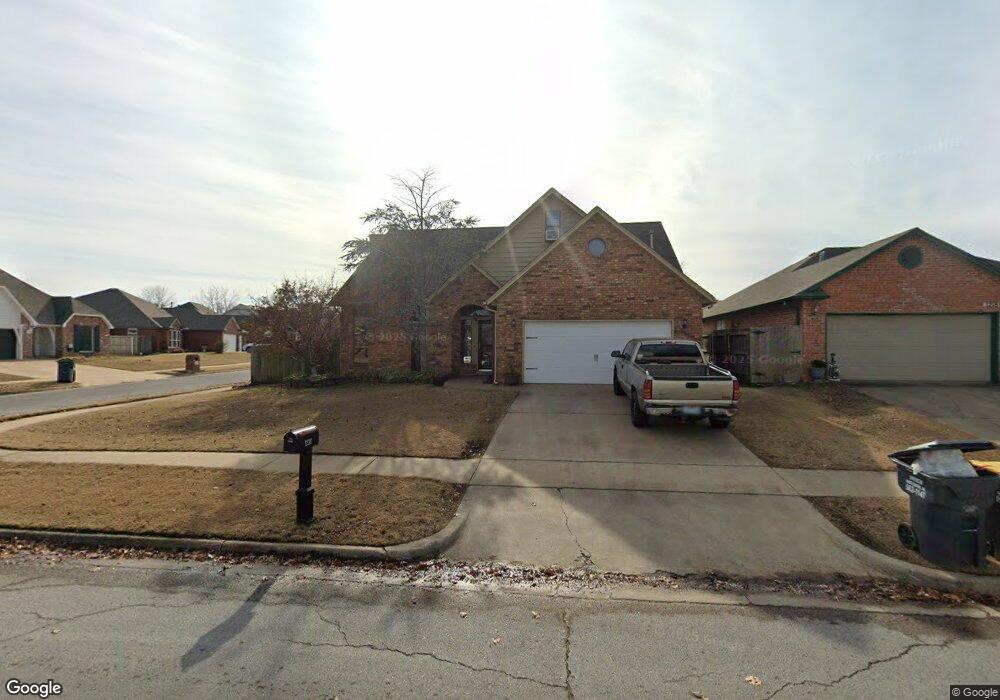
1230 E 137th St Glenpool, OK 74033
Estimated Value: $251,000 - $280,000
4
Beds
3
Baths
2,189
Sq Ft
$119/Sq Ft
Est. Value
About This Home
This home is located at 1230 E 137th St, Glenpool, OK 74033 and is currently estimated at $260,849, approximately $119 per square foot. 1230 E 137th St is a home located in Tulsa County with nearby schools including Glenpool Elementary School, Glenpool Middle School, and Glenpool High School.
Ownership History
Date
Name
Owned For
Owner Type
Purchase Details
Closed on
Sep 12, 2005
Sold by
Ogden Charles and Ogden Naomi
Bought by
Coleman Chad Justin and Coleman Jennifer Dawn
Current Estimated Value
Home Financials for this Owner
Home Financials are based on the most recent Mortgage that was taken out on this home.
Original Mortgage
$128,981
Outstanding Balance
$67,851
Interest Rate
5.78%
Mortgage Type
FHA
Estimated Equity
$192,998
Purchase Details
Closed on
Apr 15, 2005
Sold by
Morris Reedy D and Morris Reedy Dewayne
Bought by
Ogden Charles and Ogden Naomi
Home Financials for this Owner
Home Financials are based on the most recent Mortgage that was taken out on this home.
Original Mortgage
$120,889
Interest Rate
5.78%
Mortgage Type
Fannie Mae Freddie Mac
Purchase Details
Closed on
Oct 21, 2003
Sold by
Morris Ina Louise
Bought by
Morris Reedy Dewayne
Purchase Details
Closed on
Jul 1, 1996
Create a Home Valuation Report for This Property
The Home Valuation Report is an in-depth analysis detailing your home's value as well as a comparison with similar homes in the area
Home Values in the Area
Average Home Value in this Area
Purchase History
| Date | Buyer | Sale Price | Title Company |
|---|---|---|---|
| Coleman Chad Justin | $130,000 | -- | |
| Ogden Charles | $117,000 | The Executives Title & Escro | |
| Morris Reedy Dewayne | -- | -- | |
| -- | $95,000 | -- |
Source: Public Records
Mortgage History
| Date | Status | Borrower | Loan Amount |
|---|---|---|---|
| Open | Coleman Chad Justin | $128,981 | |
| Previous Owner | Ogden Charles | $120,889 |
Source: Public Records
Tax History Compared to Growth
Tax History
| Year | Tax Paid | Tax Assessment Tax Assessment Total Assessment is a certain percentage of the fair market value that is determined by local assessors to be the total taxable value of land and additions on the property. | Land | Improvement |
|---|---|---|---|---|
| 2025 | $1,899 | $15,839 | $1,497 | $14,342 |
| 2024 | $1,741 | $15,350 | $1,515 | $13,835 |
| 2023 | $1,741 | $15,873 | $1,733 | $14,140 |
| 2022 | $1,661 | $14,411 | $2,077 | $12,334 |
| 2021 | $1,634 | $13,962 | $2,012 | $11,950 |
| 2020 | $1,646 | $13,962 | $2,012 | $11,950 |
| 2019 | $1,657 | $13,962 | $2,012 | $11,950 |
| 2018 | $1,650 | $13,962 | $2,012 | $11,950 |
| 2017 | $1,605 | $14,877 | $2,144 | $12,733 |
| 2016 | $1,570 | $14,443 | $2,156 | $12,287 |
| 2015 | $1,562 | $14,443 | $2,156 | $12,287 |
| 2014 | $1,569 | $14,443 | $2,156 | $12,287 |
Source: Public Records
Map
Nearby Homes
- 13761 S Nyssa Ct
- 13846 S Nyssa Place
- 1024 E 135th Place
- 1221 E 134th St
- 13520 S Poplar Ct
- 2355 E 135th Place
- 13959 S Poplar St
- 14004 S Poplar St
- 1286 E 140th Place
- 243 E 141st St
- 13642 S Iroquois Ave
- 13672 S Kenosha Ave
- 1076 E 131st Place
- 14969 S Poplar Place
- 15025 S Oak St
- 15013 S Oak St
- 14009 S Kenosha Ave
- 687 E 142nd Place
- 1264 E 145th Place
- 13826 S Elm St
- 1218 E 137th St
- 1206 E 137th St
- 13713 S Nyssa Ct
- 13680 S Nyssa Ct
- 13699 S Nyssa Ct
- 13725 S Nyssa Ct
- 13736 S Nyssa Ct
- 13679 S Nyssa Ct
- 13737 S Nyssa Place
- 1194 E 137th St
- 1207 E 137th St
- 13660 S Nyssa Ct
- 13737 S Nyssa Ct
- 13659 S Nyssa Ct Unit 4390
- 13748 S Nyssa Ct
- 13749 S Nyssa Place
- 1195 E 137th St
- 13714 S Oak St
- 13688 S Oak St