


1230 Melton Rd West Union, SC 29696
Estimated payment $1,397/month
Highlights
- Boat Dock
- Fitness Center
- Clubhouse
- Water Access
- Gated Community
- High Ceiling
About This Home
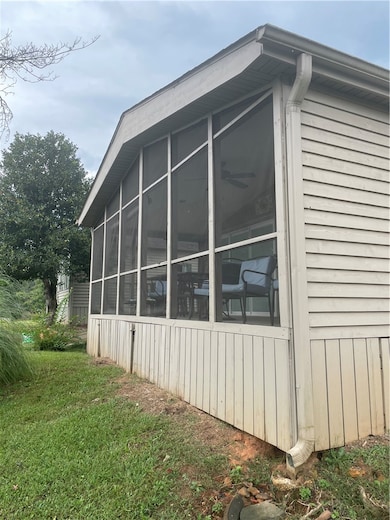
This home is located at 1230 Melton Rd, West Union, SC 29696 and is currently priced at $249,900. 1230 Melton Rd is a home located in Oconee County with nearby schools including Northside Elementary School, Seneca Middle School, and Seneca High School.
Property Details
Home Type
- Mobile/Manufactured
Est. Annual Taxes
- $963
Parking
- Driveway
Home Design
- Cottage
- Wood Siding
Interior Spaces
- 1-Story Property
- Bookcases
- High Ceiling
- Ceiling Fan
- Vinyl Clad Windows
- Insulated Windows
- Blinds
- Bay Window
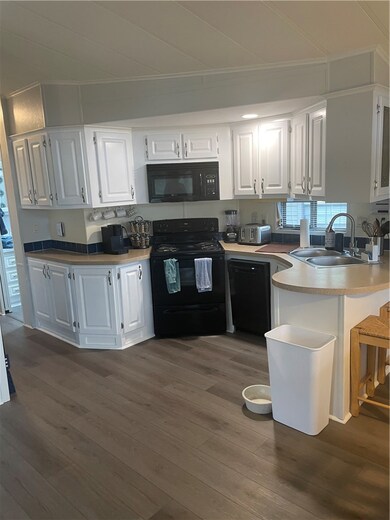
- Luxury Vinyl Plank Tile Flooring
- Crawl Space
Kitchen
- Breakfast Room
- Laminate Countertops
Bedrooms and Bathrooms
- 2 Bedrooms
- Bathroom on Main Level
- 2 Full Bathrooms
- Shower Only
- Walk-in Shower
Laundry
- Dryer
- Washer
Outdoor Features
- Water Access
- Screened Patio
- Porch
Schools
- Walhalla Elementary School
- Walhalla Middle School
- Walhalla High School
Utilities
- Cooling Available
- Forced Air Heating System
- Septic Tank
- Cable TV Available
Additional Features
- Low Threshold Shower
- Outside City Limits
Listing and Financial Details
- Assessor Parcel Number 1770401019
Community Details
Overview
- Property has a Home Owners Association
- Association fees include common areas, ground maintenance, pool(s), sewer, street lights, security, water
- Backwater Landing Subdivision
Amenities
- Common Area
- Clubhouse
- Community Storage Space
Recreation
- Boat Dock
- Community Boat Facilities
- Fitness Center
- Community Pool
- Trails
Pet Policy
- Pets Allowed
Security
- Gated Community
Map
Home Values in the Area
Average Home Value in this Area
Tax History
| Year | Tax Paid | Tax Assessment Tax Assessment Total Assessment is a certain percentage of the fair market value that is determined by local assessors to be the total taxable value of land and additions on the property. | Land | Improvement |
|---|---|---|---|---|
| 2025 | $963 | $2,984 | $0 | $2,984 |
| 2024 | $963 | $2,984 | $0 | $2,984 |
| 2023 | $963 | $2,984 | $0 | $2,984 |
| 2022 | $976 | $2,984 | $0 | $2,984 |
| 2021 | $813 | $2,830 | $0 | $2,830 |
| 2020 | $968 | $0 | $0 | $0 |
| 2019 | $968 | $0 | $0 | $0 |
| 2018 | $943 | $0 | $0 | $0 |
| 2017 | $813 | $0 | $0 | $0 |
| 2016 | $813 | $0 | $0 | $0 |
| 2015 | -- | $0 | $0 | $0 |
| 2014 | -- | $3,777 | $0 | $3,777 |
| 2013 | -- | $0 | $0 | $0 |
Property History
| Date | Event | Price | List to Sale | Price per Sq Ft | Prior Sale |
|---|---|---|---|---|---|
| 08/27/2025 08/27/25 | For Sale | $249,900 | 0.0% | -- | |
| 06/20/2022 06/20/22 | Sold | $250,000 | -3.8% | $278 / Sq Ft | View Prior Sale |
| 05/18/2022 05/18/22 | Pending | -- | -- | -- | |
| 05/15/2022 05/15/22 | For Sale | $259,900 | +5.0% | $289 / Sq Ft | |
| 07/06/2021 07/06/21 | Sold | $247,500 | -0.6% | $248 / Sq Ft | View Prior Sale |
| 04/30/2021 04/30/21 | Sold | $249,000 | -0.4% | $247 / Sq Ft | View Prior Sale |
| 04/08/2021 04/08/21 | For Sale | $249,900 | +0.4% | $250 / Sq Ft | |
| 03/08/2021 03/08/21 | Pending | -- | -- | -- | |
| 03/04/2021 03/04/21 | For Sale | $249,000 | +71.8% | $247 / Sq Ft | |
| 05/29/2020 05/29/20 | Sold | $144,900 | -40.8% | $143 / Sq Ft | View Prior Sale |
| 04/29/2020 04/29/20 | Pending | -- | -- | -- | |
| 03/29/2020 03/29/20 | For Sale | $244,900 | -10.9% | $242 / Sq Ft | |
| 06/21/2019 06/21/19 | Sold | $275,000 | -1.8% | $196 / Sq Ft | View Prior Sale |
| 05/09/2019 05/09/19 | Pending | -- | -- | -- | |
| 05/04/2019 05/04/19 | For Sale | $280,000 | +100.0% | $199 / Sq Ft | |
| 05/01/2019 05/01/19 | Sold | $140,000 | -5.3% | $139 / Sq Ft | View Prior Sale |
| 03/21/2019 03/21/19 | Pending | -- | -- | -- | |
| 03/07/2019 03/07/19 | For Sale | $147,900 | +1.0% | $146 / Sq Ft | |
| 06/22/2018 06/22/18 | Sold | $146,500 | +27.4% | $145 / Sq Ft | View Prior Sale |
| 06/14/2018 06/14/18 | Pending | -- | -- | -- | |
| 06/13/2018 06/13/18 | Sold | $115,000 | -19.0% | $114 / Sq Ft | View Prior Sale |
| 05/21/2018 05/21/18 | Sold | $142,000 | -5.3% | $141 / Sq Ft | View Prior Sale |
| 05/21/2018 05/21/18 | Sold | $150,000 | +72.4% | $136 / Sq Ft | View Prior Sale |
| 05/01/2018 05/01/18 | Sold | $87,000 | -30.4% | $95 / Sq Ft | View Prior Sale |
| 05/01/2018 05/01/18 | Pending | -- | -- | -- | |
| 04/24/2018 04/24/18 | Pending | -- | -- | -- | |
| 04/24/2018 04/24/18 | Pending | -- | -- | -- | |
| 03/21/2018 03/21/18 | Pending | -- | -- | -- | |
| 02/08/2018 02/08/18 | For Sale | $125,000 | -26.5% | $124 / Sq Ft | |
| 01/26/2018 01/26/18 | Sold | $170,000 | +26.0% | $148 / Sq Ft | View Prior Sale |
| 01/13/2018 01/13/18 | For Sale | $134,900 | -15.7% | $134 / Sq Ft | |
| 01/01/2018 01/01/18 | For Sale | $160,000 | +48.1% | $145 / Sq Ft | |
| 12/28/2017 12/28/17 | Sold | $108,000 | -3.6% | $107 / Sq Ft | View Prior Sale |
| 12/08/2017 12/08/17 | For Sale | $112,000 | +13.1% | $123 / Sq Ft | |
| 11/27/2017 11/27/17 | Sold | $99,000 | -13.2% | $76 / Sq Ft | View Prior Sale |
| 10/26/2017 10/26/17 | Pending | -- | -- | -- | |
| 10/20/2017 10/20/17 | Pending | -- | -- | -- | |
| 10/13/2017 10/13/17 | Sold | $114,000 | +3.6% | $113 / Sq Ft | View Prior Sale |
| 10/05/2017 10/05/17 | Sold | $110,000 | -35.3% | $96 / Sq Ft | View Prior Sale |
| 09/24/2017 09/24/17 | Pending | -- | -- | -- | |
| 08/27/2017 08/27/17 | Pending | -- | -- | -- | |
| 08/17/2017 08/17/17 | Pending | -- | -- | -- | |
| 07/28/2017 07/28/17 | Sold | $170,000 | +14.9% | $100 / Sq Ft | View Prior Sale |
| 07/07/2017 07/07/17 | For Sale | $148,000 | +29.8% | $147 / Sq Ft | |
| 06/27/2017 06/27/17 | Pending | -- | -- | -- | |
| 06/21/2017 06/21/17 | For Sale | $114,000 | +23.2% | $113 / Sq Ft | |
| 05/26/2017 05/26/17 | Sold | $92,500 | -14.2% | $92 / Sq Ft | View Prior Sale |
| 05/02/2017 05/02/17 | Pending | -- | -- | -- | |
| 04/13/2017 04/13/17 | Sold | $107,750 | +26.8% | $111 / Sq Ft | View Prior Sale |
| 04/03/2017 04/03/17 | Sold | $85,000 | -31.5% | $85 / Sq Ft | View Prior Sale |
| 03/16/2017 03/16/17 | For Sale | $124,000 | -36.4% | $95 / Sq Ft | |
| 03/16/2017 03/16/17 | For Sale | $195,000 | +34.5% | $115 / Sq Ft | |
| 03/15/2017 03/15/17 | Sold | $145,000 | +3.6% | $145 / Sq Ft | View Prior Sale |
| 02/26/2017 02/26/17 | Pending | -- | -- | -- | |
| 02/25/2017 02/25/17 | For Sale | $139,900 | +18.6% | $139 / Sq Ft | |
| 02/23/2017 02/23/17 | Sold | $118,000 | -36.0% | $112 / Sq Ft | View Prior Sale |
| 02/20/2017 02/20/17 | Pending | -- | -- | -- | |
| 02/17/2017 02/17/17 | Pending | -- | -- | -- | |
| 01/23/2017 01/23/17 | For Sale | $184,500 | +19.9% | $160 / Sq Ft | |
| 01/16/2017 01/16/17 | Pending | -- | -- | -- | |
| 01/05/2017 01/05/17 | For Sale | $153,900 | +62.9% | $154 / Sq Ft | |
| 12/07/2016 12/07/16 | For Sale | $94,500 | -40.9% | $94 / Sq Ft | |
| 11/18/2016 11/18/16 | Sold | $160,000 | +64.1% | $160 / Sq Ft | View Prior Sale |
| 09/24/2016 09/24/16 | Pending | -- | -- | -- | |
| 09/08/2016 09/08/16 | Sold | $97,500 | -33.3% | $95 / Sq Ft | View Prior Sale |
| 09/01/2016 09/01/16 | Sold | $146,125 | +27.1% | $145 / Sq Ft | View Prior Sale |
| 08/30/2016 08/30/16 | For Sale | $115,000 | +39.4% | $118 / Sq Ft | |
| 07/28/2016 07/28/16 | Sold | $82,500 | -8.3% | $66 / Sq Ft | View Prior Sale |
| 07/26/2016 07/26/16 | Sold | $90,000 | -45.5% | $99 / Sq Ft | View Prior Sale |
| 07/19/2016 07/19/16 | Pending | -- | -- | -- | |
| 07/15/2016 07/15/16 | Sold | $165,000 | +16.1% | $163 / Sq Ft | View Prior Sale |
| 07/12/2016 07/12/16 | Pending | -- | -- | -- | |
| 07/01/2016 07/01/16 | Sold | $142,180 | -9.4% | $141 / Sq Ft | View Prior Sale |
| 06/30/2016 06/30/16 | Pending | -- | -- | -- | |
| 06/14/2016 06/14/16 | Pending | -- | -- | -- | |
| 05/31/2016 05/31/16 | For Sale | $157,000 | -12.5% | $155 / Sq Ft | |
| 05/14/2016 05/14/16 | Pending | -- | -- | -- | |
| 05/04/2016 05/04/16 | Pending | -- | -- | -- | |
| 04/05/2016 04/05/16 | For Sale | $179,500 | +86.0% | $178 / Sq Ft | |
| 01/08/2016 01/08/16 | For Sale | $96,500 | -39.3% | $106 / Sq Ft | |
| 01/05/2016 01/05/16 | For Sale | $159,000 | +59.2% | $157 / Sq Ft | |
| 12/29/2015 12/29/15 | Sold | $99,900 | -12.3% | $80 / Sq Ft | View Prior Sale |
| 12/09/2015 12/09/15 | For Sale | $113,900 | -12.0% | $111 / Sq Ft | |
| 12/09/2015 12/09/15 | For Sale | $129,500 | +45.5% | $129 / Sq Ft | |
| 11/23/2015 11/23/15 | Pending | -- | -- | -- | |
| 11/13/2015 11/13/15 | For Sale | $89,000 | -40.5% | $71 / Sq Ft | |
| 11/13/2015 11/13/15 | For Sale | $149,500 | +3.1% | $130 / Sq Ft | |
| 09/14/2015 09/14/15 | Sold | $145,000 | +29.5% | $132 / Sq Ft | View Prior Sale |
| 08/16/2015 08/16/15 | Pending | -- | -- | -- | |
| 07/14/2015 07/14/15 | For Sale | $112,000 | -53.1% | $90 / Sq Ft | |
| 06/22/2015 06/22/15 | For Sale | $239,000 | +64.8% | $239 / Sq Ft | |
| 05/08/2015 05/08/15 | For Sale | $145,000 | -12.1% | $138 / Sq Ft | |
| 03/09/2015 03/09/15 | For Sale | $164,900 | +119.9% | $150 / Sq Ft | |
| 12/22/2014 12/22/14 | Sold | $75,000 | -11.7% | $96 / Sq Ft | View Prior Sale |
| 12/04/2014 12/04/14 | Pending | -- | -- | -- | |
| 07/18/2014 07/18/14 | Sold | $84,900 | -7.7% | $77 / Sq Ft | View Prior Sale |
| 06/24/2014 06/24/14 | For Sale | $92,000 | -28.1% | $117 / Sq Ft | |
| 05/30/2014 05/30/14 | Pending | -- | -- | -- | |
| 02/19/2014 02/19/14 | For Sale | $127,900 | -- | $116 / Sq Ft |
Source: Western Upstate Multiple Listing Service
MLS Number: 20293195
APN: 177-04-01-019
Disclaimer: Certain information contained herein is derived from information provided by parties other than Homes.com. All information provided is deemed reliable, but is not guaranteed to be accurate and should be independently verified.
![]() The data relating to real estate for sale on this Web site comes in part from the Broker Reciprocity Program of the Western Upstate Association of REALTORS®, Inc. and the Western Upstate Multiple Listing Service, Inc
The data relating to real estate for sale on this Web site comes in part from the Broker Reciprocity Program of the Western Upstate Association of REALTORS®, Inc. and the Western Upstate Multiple Listing Service, Inc
This information is deemed reliable, but not guaranteed. Neither, the Western Upstate Association of REALTORS®, Inc. or Western Upstate Multiple Listing Service of South Carolina, Inc., nor the listing broker, nor their agents or subagents are responsible for the accuracy of the information. The buyer is responsible for verifying all information. This information is provided by the Western Upstate Association of REALTORS®, Inc. and Western Upstate Multiple Listing Service of South Carolina, Inc. for use by its members and is not intended for the use for any other purpose.
- 1230 Melton Rd Unit 104
- 1230 Melton Rd Unit 36
- 1230 Melton Rd Unit 82
- 1230 Melton Rd Unit 130
- 1230 Melton Rd Unit 65
- 1230 Melton Rd
- 1230 Melton Rd Unit 87
- 545 Peninsula Rd
- 509 Peninsula Rd
- 287 Waterstone Dr
- Lot 11 Little Keowee Blvd
- 00 Little Keowee Blvd
- 421 Peninsula Rd
- 338 Mcalister Rd
- 347 Mcalister Rd
- 631 Winston Way
- Lot 43 Glassy Water Way
- 6004 Glassy Water Way
- 3012 Deep Water Way
- 3021 Deep Water Way
- 210 Meridian Way
- 136 Bruce Blvd
- 156 Pine Cliff Dr
- 116 Northwoods Dr
- 515 N Walnut St Unit C
- 107 Sycamore Ln
- 405 Oakmont Valley Trail
- 109-A Towe St
- 405 Whispering Ln
- 636 Coopers Ml Dr
- 722 Peridot Way
- 735 Bellview Way
- 725 Bellview Way
- 319 Greentree Ct
- 105 Peach Dr
- 701 Broadway St
- 110 Field Village Dr
- 113 Cascade Ln
- 1500 S Oak St
- 1020 Fairfield Dr
