1230 N Palm St Turlock, CA 95380
Estimated Value: $535,503 - $550,000
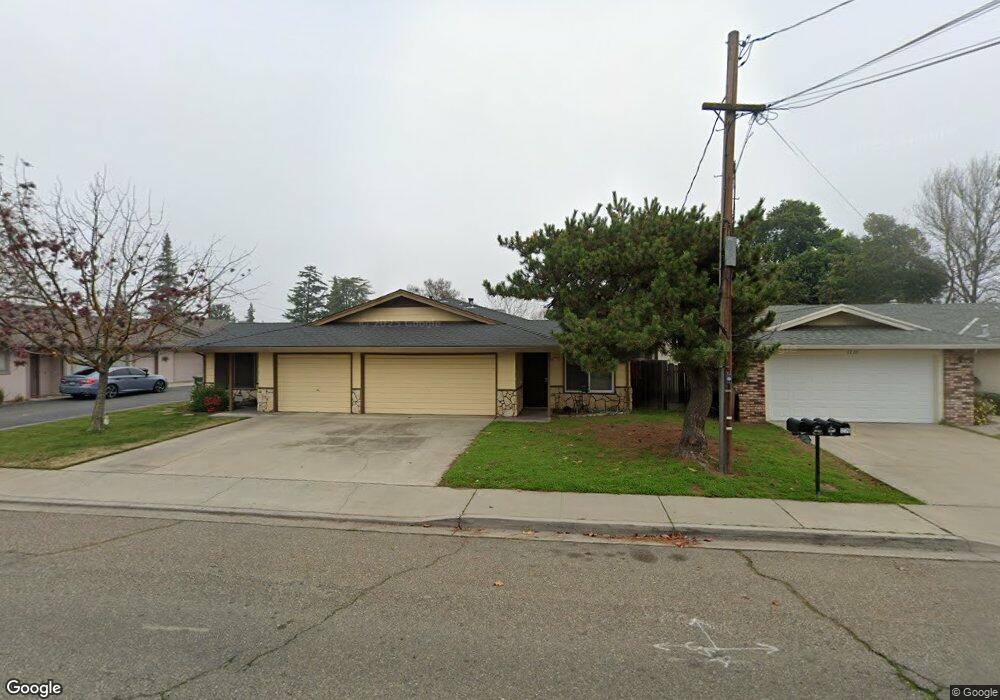
About This Home
This home is located at 1230 N Palm St, Turlock, CA 95380 and is currently estimated at $542,752, approximately $292 per square foot. 1230 N Palm St is a home with nearby schools including Crowell Elementary School, Marvin A. Dutcher Middle School, and Turlock Junior High School.
Ownership History
We collect this data history from publicly available records. To have your information removed, we recommend requesting removal directly through your county’s website.
Purchase Details
Purchase Details
Home Financials for this Owner
Home Financials are based on the most recent Mortgage that was taken out on this home.Purchase Details
Home Financials for this Owner
Home Financials are based on the most recent Mortgage that was taken out on this home.Purchase History
We collect this data history from publicly available records. To have your information removed, we recommend requesting removal directly through your county’s website.
| Date | Buyer | Sale Price | Title Company |
|---|---|---|---|
| -- | None Available | ||
| -- | Chicago Title | ||
| $215,000 | Chicago Title Co |
Mortgage History
We collect this data history from publicly available records. To have your information removed, we recommend requesting removal directly through your county’s website.
| Date | Status | Borrower | Loan Amount |
|---|---|---|---|
| Closed | $73,000 | ||
| Closed | $172,000 |
Tax History
We collect this data history from publicly available records. To have your information removed, we recommend requesting removal directly through your county’s website.
| Year | Tax Paid | Tax Assessment Tax Assessment Total Assessment is a certain percentage of the fair market value that is determined by local assessors to be the total taxable value of land and additions on the property. | Land | Improvement |
|---|---|---|---|---|
| 2025 | $3,347 | $311,370 | $52,131 | $259,239 |
| 2024 | $3,285 | $305,265 | $51,109 | $254,156 |
| 2023 | $3,280 | $299,280 | $50,107 | $249,173 |
| 2022 | $3,238 | $293,413 | $49,125 | $244,288 |
| 2021 | $3,191 | $287,661 | $48,162 | $239,499 |
| 2020 | $3,169 | $284,713 | $47,669 | $237,044 |
| 2019 | $3,116 | $279,132 | $46,735 | $232,397 |
| 2018 | $3,113 | $273,660 | $45,819 | $227,841 |
| 2017 | $3,040 | $268,295 | $44,921 | $223,374 |
| 2016 | $2,764 | $256,000 | $62,500 | $193,500 |
| 2015 | $2,315 | $213,000 | $62,500 | $150,500 |
| 2014 | $2,086 | $190,000 | $62,500 | $127,500 |
Map
- 1366 Geer Rd
- 494 Wayside Dr
- 215 E Hawkeye Ave
- 1002 Geer Rd
- 1227 Windsor Ct
- 1260 Windsor Ct
- 1300 Windsor Ct
- 1440 Windsor Ct
- 512 N Palm St
- 1760 Valparaiso Dr
- 522 Wolfe Ave
- 425 20th Century Blvd Unit A-04
- 425 20th Century Blvd Unit C-12
- 752 Mitchell Ave
- 1980 Clemson Ct
- 1945 Annhurst Ave
- 421 Allen Way
- 2120 Annhurst Ave
- 1246 E Canal Dr
- 2160 Georgia Way
Ask me questions while you tour the home.