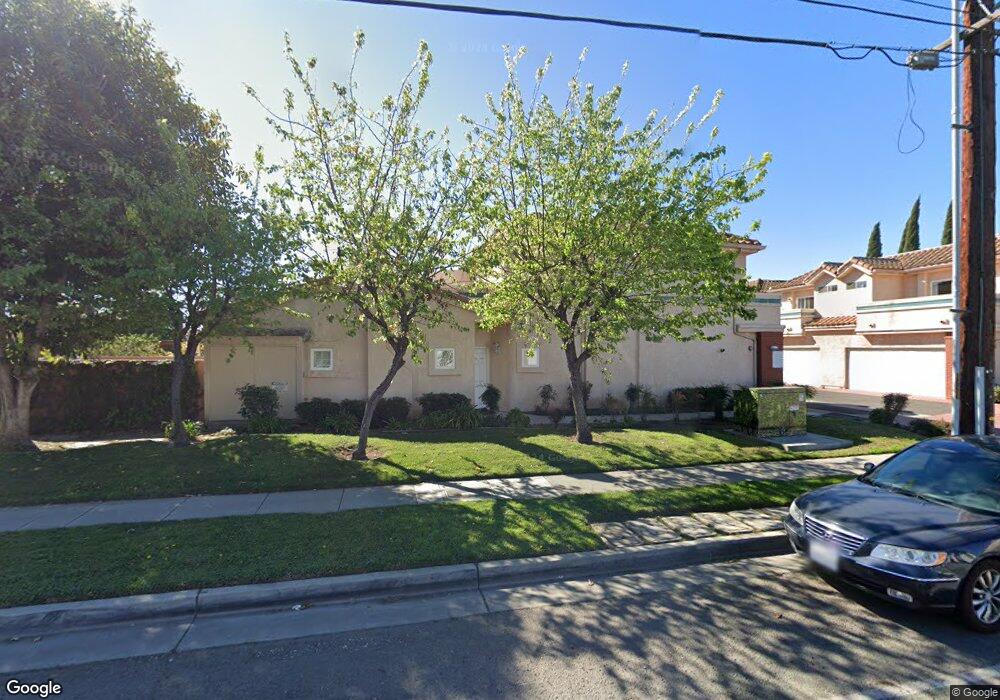
1230 S Neveen Ln Unit 11 Anaheim, CA 92804
West Anaheim NeighborhoodEstimated Value: $685,000 - $731,693
3
Beds
3
Baths
1,403
Sq Ft
$505/Sq Ft
Est. Value
About This Home
This home is located at 1230 S Neveen Ln Unit 11, Anaheim, CA 92804 and is currently estimated at $708,423, approximately $504 per square foot. 1230 S Neveen Ln Unit 11 is a home located in Orange County with nearby schools including Hansen Elementary School, Orangeview Junior High, and Western High School.
Ownership History
Date
Name
Owned For
Owner Type
Purchase Details
Closed on
Feb 25, 2016
Sold by
Patel Rajesh K and Patel Malvika R
Bought by
The Patel Living Trust
Current Estimated Value
Purchase Details
Closed on
Mar 13, 2003
Sold by
Kim Young Ho
Bought by
Kim Sun Yo
Home Financials for this Owner
Home Financials are based on the most recent Mortgage that was taken out on this home.
Original Mortgage
$237,500
Interest Rate
5.79%
Purchase Details
Closed on
Feb 5, 2003
Sold by
Shin James U and Shin Serin
Bought by
Kim Sun Yo
Home Financials for this Owner
Home Financials are based on the most recent Mortgage that was taken out on this home.
Original Mortgage
$237,500
Interest Rate
5.79%
Purchase Details
Closed on
Jul 28, 1998
Sold by
Federal National Mortgage Association
Bought by
Shin James U and Shin Serin
Home Financials for this Owner
Home Financials are based on the most recent Mortgage that was taken out on this home.
Original Mortgage
$139,550
Interest Rate
6.9%
Purchase Details
Closed on
Mar 25, 1998
Sold by
Castro George B and Castro Margaret B
Bought by
Federal National Mortgage Association
Create a Home Valuation Report for This Property
The Home Valuation Report is an in-depth analysis detailing your home's value as well as a comparison with similar homes in the area
Home Values in the Area
Average Home Value in this Area
Purchase History
| Date | Buyer | Sale Price | Title Company |
|---|---|---|---|
| The Patel Living Trust | -- | None Available | |
| Kim Sun Yo | -- | -- | |
| Kim Sun Yo | $279,000 | -- | |
| Shin James U | $144,000 | Fidelity National Title Ins | |
| Federal National Mortgage Association | $140,000 | Landsafe Title |
Source: Public Records
Mortgage History
| Date | Status | Borrower | Loan Amount |
|---|---|---|---|
| Previous Owner | Kim Sun Yo | $237,500 | |
| Previous Owner | Shin James U | $139,550 |
Source: Public Records
Tax History Compared to Growth
Tax History
| Year | Tax Paid | Tax Assessment Tax Assessment Total Assessment is a certain percentage of the fair market value that is determined by local assessors to be the total taxable value of land and additions on the property. | Land | Improvement |
|---|---|---|---|---|
| 2025 | $7,101 | $614,817 | $343,743 | $271,074 |
| 2024 | $7,101 | $602,762 | $337,003 | $265,759 |
| 2023 | $6,920 | $590,944 | $330,395 | $260,549 |
| 2022 | $6,174 | $524,280 | $314,272 | $210,008 |
| 2021 | $6,236 | $514,000 | $308,109 | $205,891 |
| 2020 | $5,853 | $482,460 | $276,569 | $205,891 |
| 2019 | $5,691 | $473,000 | $271,146 | $201,854 |
| 2018 | $5,718 | $473,000 | $271,146 | $201,854 |
| 2017 | $5,054 | $422,000 | $220,146 | $201,854 |
| 2016 | $5,127 | $422,000 | $220,146 | $201,854 |
| 2015 | $4,713 | $384,000 | $182,146 | $201,854 |
| 2014 | $4,015 | $334,800 | $132,946 | $201,854 |
Source: Public Records
Map
Nearby Homes
- 3218 W Ravenswood Dr
- 1304 S Courson Dr
- 1305 S Westchester Dr
- 3245 Donovan Ranch Rd
- 3213 W Sunview Dr
- 1203 S Courtright St
- 3120 W Ball Rd
- 3050 W Ball Rd Unit 171
- 3050 W Ball Rd Unit 115B
- 3050 W Ball Rd Unit 127
- 3050 W Ball Rd Unit 132
- 3050 W Ball Rd Unit 82
- 3050 W Ball Rd Unit 200
- 3050 W Ball Rd Unit 152
- 3050 W Ball Rd Unit 88
- 10420 Vassar Way
- 3333 W Keys Ln
- 3501 W Greentree Cir Unit F
- 3565 W Stonepine Ln Unit B
- 10531 Western Ave
- 1210 S Neveen Ln Unit 13
- 1220 S Neveen Ln Unit 12
- 1245 S Neveen Ln Unit 4
- 1255 S Neveen Ln
- 1235 S Neveen Ln Unit 5
- 1265 S Neveen Ln Unit 2
- 1225 S Neveen Ln
- 1240 S Neveen Ln Unit 10
- 1275 S Neveen Ln Unit 1
- 1215 S Neveen Ln
- 1200 S Neveen Ln
- 1250 S Neveen Ln
- 1205 S Neveen Ln Unit 8
- 1224 S Cabernet Cir
- 1220 S Cabernet Cir
- 1209 S Ramblewood Dr
- 1214 S Cabernet Cir Unit 14
- 1230 S Cabernet Cir Unit 11
- 1203 S Ramblewood Dr
- 1210 S Cabernet Cir Unit 15