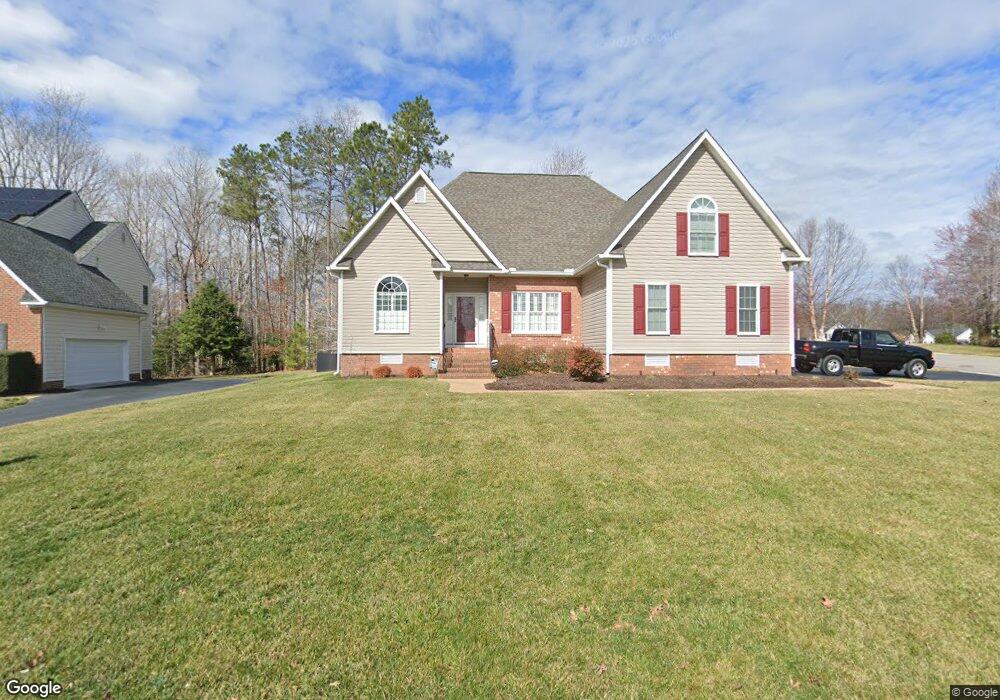
12301 Penny Bridge Dr Midlothian, VA 23112
Estimated Value: $479,700 - $527,000
4
Beds
3
Baths
2,389
Sq Ft
$213/Sq Ft
Est. Value
About This Home
This home is located at 12301 Penny Bridge Dr, Midlothian, VA 23112 and is currently estimated at $507,675, approximately $212 per square foot. 12301 Penny Bridge Dr is a home located in Chesterfield County with nearby schools including Alberta Smith Elementary School, Bailey Bridge Middle School, and Manchester High.
Ownership History
Date
Name
Owned For
Owner Type
Purchase Details
Closed on
Sep 1, 2017
Sold by
Bishop Sr Seven D and Bishop Ruth A
Bought by
Mann Robert Shane and Mann Dana Marie
Current Estimated Value
Home Financials for this Owner
Home Financials are based on the most recent Mortgage that was taken out on this home.
Original Mortgage
$303,750
Outstanding Balance
$253,857
Interest Rate
3.93%
Mortgage Type
New Conventional
Estimated Equity
$253,818
Purchase Details
Closed on
Jun 15, 2011
Sold by
Berger Construction Co Inc
Bought by
Bishop Steven D
Home Financials for this Owner
Home Financials are based on the most recent Mortgage that was taken out on this home.
Original Mortgage
$195,950
Interest Rate
4.74%
Mortgage Type
New Conventional
Purchase Details
Closed on
May 6, 2011
Sold by
Bayhill Development Corp
Bought by
Berger Construction Co Inc
Home Financials for this Owner
Home Financials are based on the most recent Mortgage that was taken out on this home.
Original Mortgage
$195,950
Interest Rate
4.74%
Mortgage Type
New Conventional
Create a Home Valuation Report for This Property
The Home Valuation Report is an in-depth analysis detailing your home's value as well as a comparison with similar homes in the area
Home Values in the Area
Average Home Value in this Area
Purchase History
| Date | Buyer | Sale Price | Title Company |
|---|---|---|---|
| Mann Robert Shane | $324,000 | Attorney | |
| Bishop Steven D | $295,950 | -- | |
| Berger Construction Co Inc | $60,000 | -- |
Source: Public Records
Mortgage History
| Date | Status | Borrower | Loan Amount |
|---|---|---|---|
| Open | Mann Robert Shane | $303,750 | |
| Previous Owner | Bishop Steven D | $195,950 |
Source: Public Records
Tax History Compared to Growth
Tax History
| Year | Tax Paid | Tax Assessment Tax Assessment Total Assessment is a certain percentage of the fair market value that is determined by local assessors to be the total taxable value of land and additions on the property. | Land | Improvement |
|---|---|---|---|---|
| 2025 | $4,173 | $466,100 | $78,000 | $388,100 |
| 2024 | $4,173 | $448,300 | $75,000 | $373,300 |
| 2023 | $3,939 | $432,900 | $75,000 | $357,900 |
| 2022 | $3,365 | $365,800 | $75,000 | $290,800 |
| 2021 | $3,339 | $346,700 | $75,000 | $271,700 |
| 2020 | $3,145 | $331,000 | $75,000 | $256,000 |
| 2019 | $3,031 | $319,100 | $74,000 | $245,100 |
| 2018 | $3,031 | $319,100 | $74,000 | $245,100 |
| 2017 | $2,988 | $311,200 | $70,000 | $241,200 |
| 2016 | $2,850 | $296,900 | $70,000 | $226,900 |
| 2015 | $2,835 | $292,700 | $70,000 | $222,700 |
| 2014 | $2,689 | $277,500 | $68,000 | $209,500 |
Source: Public Records
Map
Nearby Homes
- 12306 Bailey Oak Ct
- 12507 Erika Hill Way
- 12206 Tavern Hill Ct
- 7018 Spring Trace Terrace
- 12841 Penny Ln
- 6301 Cedar Springs Rd
- 13305 Pointer Ridge Terrace
- 12219 Old Bailey Bridge Rd
- 5248 Misty Spring Dr
- 4916 Terrace Arbor Cir
- 7736 Secretariat Dr
- 13707 Swale Ln
- 7706 Northern Dancer Ct
- 5054 Glen Tara Dr
- 13006 Hensley Rd
- 5112 Twelveoaks Rd
- 13501 Buck Rub Dr
- 13100 Hensley Rd
- 9933 Third Branch Dr
- Lot 15 Qualla Connector Trail
- 9100 Penny Bridge Place
- 9106 Penny Bridge Ct
- 12305 Penny Bridge Dr
- 9018 Penny Bridge Mews
- 12219 Penny Bridge Dr
- 9112 Penny Bridge Ct
- 12307 Penny Bridge Dr
- 12218 Penny Bridge Dr
- 9012 Penny Bridge Mews
- 9119 Penny Bridge Ct
- 12213 Penny Bridge Dr
- 12311 Penny Bridge Dr
- 9124 Penny Bridge Ct
- 9013 Penny Bridge Mews
- 9006 Penny Bridge Mews
- 12313 Penny Bridge Dr
- 12312 Penny Bridge Dr
- 9125 Penny Bridge Ct
- 12212 Penny Bridge Dr
- 12207 Penny Bridge Dr