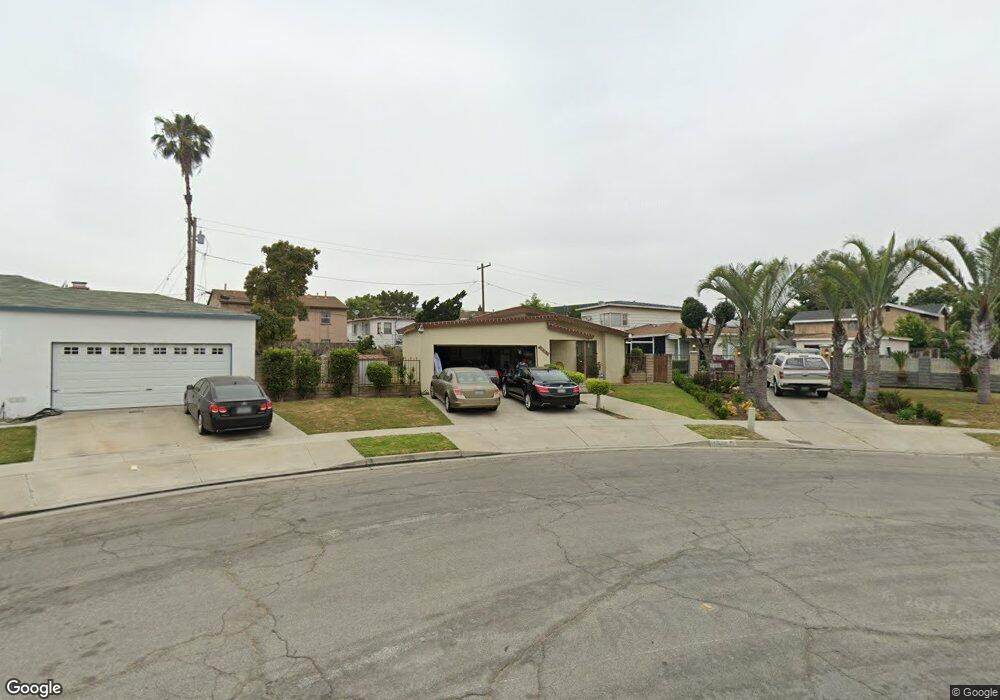
12301 S Anzac Ave Compton, CA 90222
Estimated Value: $618,000 - $796,000
3
Beds
2
Baths
1,518
Sq Ft
$470/Sq Ft
Est. Value
About This Home
This home is located at 12301 S Anzac Ave, Compton, CA 90222 and is currently estimated at $714,148, approximately $470 per square foot. 12301 S Anzac Ave is a home located in Los Angeles County with nearby schools including Carver Elementary School, Bunche Middle School, and Centennial High School.
Ownership History
Date
Name
Owned For
Owner Type
Purchase Details
Closed on
Sep 24, 2019
Sold by
Heard Addie Mae
Bought by
Heard Addie Mae and Addie Mae Heard Family Trust
Current Estimated Value
Home Financials for this Owner
Home Financials are based on the most recent Mortgage that was taken out on this home.
Original Mortgage
$143,000
Outstanding Balance
$110,288
Interest Rate
3.6%
Estimated Equity
$603,860
Purchase Details
Closed on
Nov 28, 2018
Sold by
Heard Addie Mae
Bought by
Heard Addie Mae and Addie Mae Heard Family Trust
Purchase Details
Closed on
Oct 26, 2006
Sold by
Watts Labor Community Action Committee
Bought by
Heard Addie and Heard Odell
Home Financials for this Owner
Home Financials are based on the most recent Mortgage that was taken out on this home.
Original Mortgage
$110,274
Interest Rate
6.36%
Mortgage Type
Seller Take Back
Create a Home Valuation Report for This Property
The Home Valuation Report is an in-depth analysis detailing your home's value as well as a comparison with similar homes in the area
Home Values in the Area
Average Home Value in this Area
Purchase History
| Date | Buyer | Sale Price | Title Company |
|---|---|---|---|
| Heard Addie Mae | -- | North American Title Company | |
| Heard Addie Mae | -- | North American Title Company | |
| Heard Addie Mae | -- | None Available | |
| Heard Addie | $110,500 | Commonwealth Land Title Co |
Source: Public Records
Mortgage History
| Date | Status | Borrower | Loan Amount |
|---|---|---|---|
| Open | Heard Addie Mae | $143,000 | |
| Previous Owner | Heard Addie | $110,274 |
Source: Public Records
Tax History
| Year | Tax Paid | Tax Assessment Tax Assessment Total Assessment is a certain percentage of the fair market value that is determined by local assessors to be the total taxable value of land and additions on the property. | Land | Improvement |
|---|---|---|---|---|
| 2025 | $7,658 | $602,887 | $468,919 | $133,968 |
| 2024 | $7,658 | $591,067 | $459,725 | $131,342 |
| 2023 | $7,559 | $579,478 | $450,711 | $128,767 |
| 2022 | $7,013 | $568,117 | $441,874 | $126,243 |
| 2021 | $6,462 | $497,000 | $387,000 | $110,000 |
| 2019 | $4,978 | $371,000 | $288,600 | $82,400 |
| 2018 | $5,819 | $447,000 | $347,700 | $99,300 |
| 2016 | $4,765 | $365,000 | $247,400 | $117,600 |
| 2015 | $4,329 | $343,300 | $232,700 | $110,600 |
| 2014 | $3,793 | $295,000 | $200,000 | $95,000 |
Source: Public Records
Map
Nearby Homes
- 2010 E 122nd St
- 1726 E 122nd St
- 12106 S Willowbrook Ave
- 12116 S Willowbrook Ave
- 12120 S Willowbrook Ave
- 2143 E 126th St
- 1644 E 122nd St
- 2222 E 124th St
- 1950 N Bloom Dr
- 2402 E 126th St
- 1563 E 119th St
- 2366 E 119th St
- 2443 E 124th St
- 11847 Alabama St
- 2207 N Anzac Ave
- 1783 E Imperial Hwy
- 850 W 132nd St
- 2531 E 124th St
- 11727 Alabama St
- 12624 S Mona Blvd
- 12305 S Anzac Ave
- 1923 E 123rd St
- 1931 E 123rd St
- 12226 S Wilmington Ave
- 12311 S Anzac Ave
- 1935 E 123rd St
- 1916 E 122nd St
- 1922 E 122nd St
- 12317 S Anzac Ave
- 1912 E 122nd St
- 1928 E 122nd St
- 12308 S Anzac Ave
- 1941 E 123rd St
- 1934 E 122nd St
- 12200 S Wilmington Ave
- 12314 S Anzac Ave
- 12323 S Anzac Ave
- 1940 E 122nd St
- 1947 E 123rd St
- 1946 E 123rd St
Your Personal Tour Guide
Ask me questions while you tour the home.