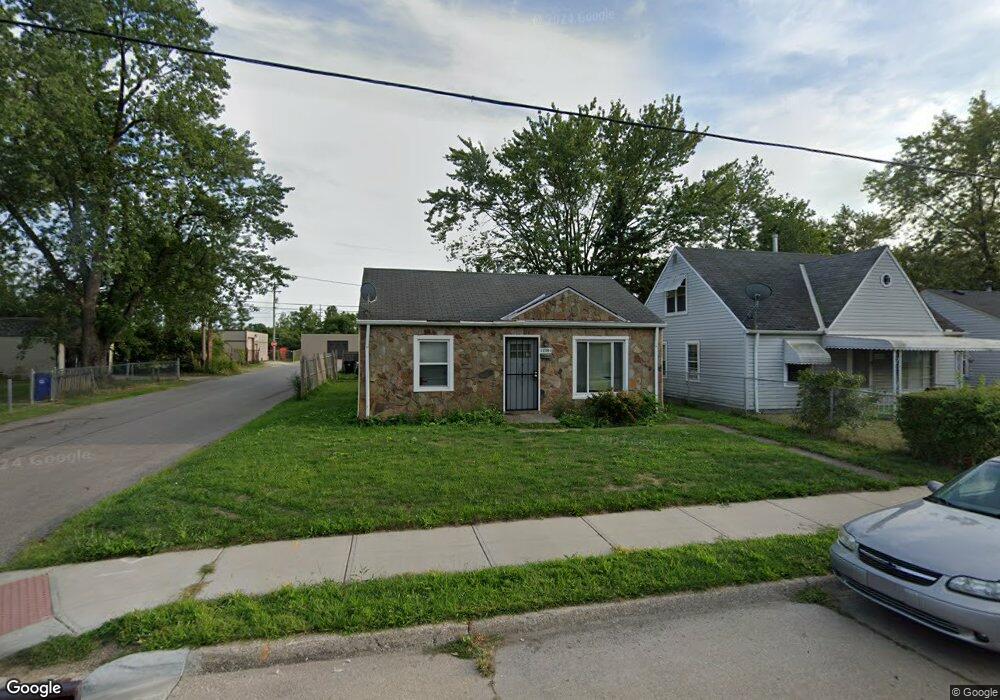
12301 Sobieski Ave Cleveland, OH 44135
Bellaire-Puritas NeighborhoodEstimated Value: $104,000 - $124,000
2
Beds
1
Bath
878
Sq Ft
$129/Sq Ft
Est. Value
About This Home
This home is located at 12301 Sobieski Ave, Cleveland, OH 44135 and is currently estimated at $113,620, approximately $129 per square foot. 12301 Sobieski Ave is a home located in Cuyahoga County with nearby schools including Artemus Ward School, Almira Academy, and Benjamin Franklin.
Ownership History
Date
Name
Owned For
Owner Type
Purchase Details
Closed on
Sep 2, 2025
Sold by
Jh Westside Llc and Lee Jian Hong
Bought by
Jh Westside Llc
Current Estimated Value
Purchase Details
Closed on
Aug 3, 2025
Sold by
Lee Kenneth and Lee Jian Hong
Bought by
Jh Westside Llc
Purchase Details
Closed on
Dec 11, 2024
Sold by
Zheng Kai and Zheng Qun
Bought by
Lee Kenneth and Lee Jian Hong
Purchase Details
Closed on
Nov 20, 2013
Sold by
Dey Yvette
Bought by
Grose Loretta
Purchase Details
Closed on
Nov 17, 2008
Sold by
Roy Gary D and Roy Ruth
Bought by
Dey Yvette
Home Financials for this Owner
Home Financials are based on the most recent Mortgage that was taken out on this home.
Original Mortgage
$21,600
Interest Rate
6.48%
Mortgage Type
Purchase Money Mortgage
Purchase Details
Closed on
Mar 22, 1985
Sold by
Roy Stanley G and Roy Mildred
Bought by
Roy Stanley G and Roy Mildred
Purchase Details
Closed on
Jan 1, 1975
Bought by
Roy Stanley G and Roy Mildred
Create a Home Valuation Report for This Property
The Home Valuation Report is an in-depth analysis detailing your home's value as well as a comparison with similar homes in the area
Home Values in the Area
Average Home Value in this Area
Purchase History
| Date | Buyer | Sale Price | Title Company |
|---|---|---|---|
| Jh Westside Llc | -- | None Listed On Document | |
| Jh Westside Llc | -- | None Listed On Document | |
| Lee Kenneth | $21,000 | None Listed On Document | |
| Lee Kenneth | $21,000 | None Listed On Document | |
| Grose Loretta | $1,000 | None Available | |
| Dey Yvette | $27,000 | Prism Title & Closing Servic | |
| Roy Stanley G | -- | -- | |
| Roy Stanley G | -- | -- |
Source: Public Records
Mortgage History
| Date | Status | Borrower | Loan Amount |
|---|---|---|---|
| Previous Owner | Dey Yvette | $21,600 |
Source: Public Records
Tax History Compared to Growth
Tax History
| Year | Tax Paid | Tax Assessment Tax Assessment Total Assessment is a certain percentage of the fair market value that is determined by local assessors to be the total taxable value of land and additions on the property. | Land | Improvement |
|---|---|---|---|---|
| 2024 | $2,057 | $30,765 | $6,965 | $23,800 |
| 2023 | $1,140 | $14,700 | $3,010 | $11,690 |
| 2022 | $1,133 | $14,700 | $3,010 | $11,690 |
| 2021 | $1,097 | $14,700 | $3,010 | $11,690 |
| 2020 | $986 | $11,410 | $2,350 | $9,070 |
| 2019 | $912 | $32,600 | $6,700 | $25,900 |
| 2018 | $909 | $11,410 | $2,350 | $9,070 |
| 2017 | $944 | $11,450 | $2,030 | $9,420 |
| 2016 | $937 | $11,450 | $2,030 | $9,420 |
| 2015 | $1,809 | $11,450 | $2,030 | $9,420 |
| 2014 | $1,809 | $12,430 | $2,210 | $10,220 |
Source: Public Records
Map
Nearby Homes
- 12510 Grimsby Ave
- 12508 Sobieski Ave
- 12620 Grimsby Ave
- 11913 Matherson Ave
- 12312 Guardian Blvd
- 11808 Leeila Ave
- 4329 W 131st St
- 4059 W 130th St
- 13209 Liberty Ave
- 13206 Liberty Ave
- 4349 W 132nd St
- 13313 Highlandview Ave
- 13402 Saint James Ave
- 12010 Longmead Ave
- 12400 Saint John Ave
- 13410 Gilmore Ave
- 12510 Summerland Ave
- 12605 Brooklawn Ave
- 12613 Milligan Ave
- 3958 W 130th St
- 12305 Sobieski Ave
- 12309 Sobieski Ave
- 12217 Sobieski Ave
- 12310 Grimsby Ave
- 12300 Sobieski Ave
- 12226 Sobieski Ave
- 12304 Sobieski Ave
- 12414 Grimsby Ave
- 12222 Sobieski Ave
- 12308 Sobieski Ave
- 12218 Sobieski Ave
- 12412 Sobieski Ave
- 12421 Sobieski Ave
- 12214 Sobieski Ave
- 12416 Sobieski Ave
- 12422 Grimsby Ave
- 12425 Sobieski Ave
- 12420 Sobieski Ave
- 12424 Grimsby Ave
- 12309 Wanda Ave