12301 Via Derna Place Orlando, FL 32836
Estimated Value: $402,000 - $474,018
4
Beds
4
Baths
1,936
Sq Ft
$232/Sq Ft
Est. Value
About This Home
This home is located at 12301 Via Derna Place, Orlando, FL 32836 and is currently estimated at $448,755, approximately $231 per square foot. 12301 Via Derna Place is a home located in Orange County with nearby schools including Bay Lake Elementary School, Horizon West Middle School, and Windermere High School.
Ownership History
Date
Name
Owned For
Owner Type
Purchase Details
Closed on
Aug 13, 2024
Sold by
Montgomery Street Homes Llc
Bought by
Hewell Michael
Current Estimated Value
Home Financials for this Owner
Home Financials are based on the most recent Mortgage that was taken out on this home.
Original Mortgage
$439,204
Outstanding Balance
$434,310
Interest Rate
6.95%
Mortgage Type
VA
Estimated Equity
$14,445
Purchase Details
Closed on
Sep 25, 2021
Sold by
Hankins-Koppel Laurel K and Hankins-Koppel Jeffrey
Bought by
Montgomery Street Homes Llc
Purchase Details
Closed on
Jul 22, 2016
Sold by
Ratcliffe David
Bought by
Hankins Koppel Laurel K and Hankins Koppel Jeffrey
Purchase Details
Closed on
Mar 24, 2014
Sold by
Ashton Orlando Residential Llc
Bought by
Ratclife David
Create a Home Valuation Report for This Property
The Home Valuation Report is an in-depth analysis detailing your home's value as well as a comparison with similar homes in the area
Home Values in the Area
Average Home Value in this Area
Purchase History
| Date | Buyer | Sale Price | Title Company |
|---|---|---|---|
| Hewell Michael | $429,960 | Divvy Title Agency | |
| Montgomery Street Homes Llc | $385,000 | None Listed On Document | |
| Hankins Koppel Laurel K | $268,500 | Hometown Title Group Inc | |
| Ratclife David | $305,800 | Attorney |
Source: Public Records
Mortgage History
| Date | Status | Borrower | Loan Amount |
|---|---|---|---|
| Open | Hewell Michael | $439,204 |
Source: Public Records
Tax History Compared to Growth
Tax History
| Year | Tax Paid | Tax Assessment Tax Assessment Total Assessment is a certain percentage of the fair market value that is determined by local assessors to be the total taxable value of land and additions on the property. | Land | Improvement |
|---|---|---|---|---|
| 2025 | $6,395 | $406,490 | $70,000 | $336,490 |
| 2024 | $5,188 | $406,490 | $70,000 | $336,490 |
| 2023 | $5,188 | $298,597 | $40,000 | $258,597 |
| 2022 | $5,108 | $296,608 | $60,000 | $236,608 |
| 2021 | $3,765 | $245,135 | $40,000 | $205,135 |
| 2020 | $3,671 | $246,634 | $40,000 | $206,634 |
| 2019 | $4,023 | $257,377 | $0 | $0 |
| 2018 | $3,963 | $252,578 | $0 | $0 |
| 2017 | $3,886 | $247,383 | $38,000 | $209,383 |
| 2016 | $4,519 | $240,931 | $38,000 | $202,931 |
| 2015 | $4,308 | $223,318 | $38,000 | $185,318 |
| 2014 | $721 | $13,695 | $13,695 | $0 |
Source: Public Records
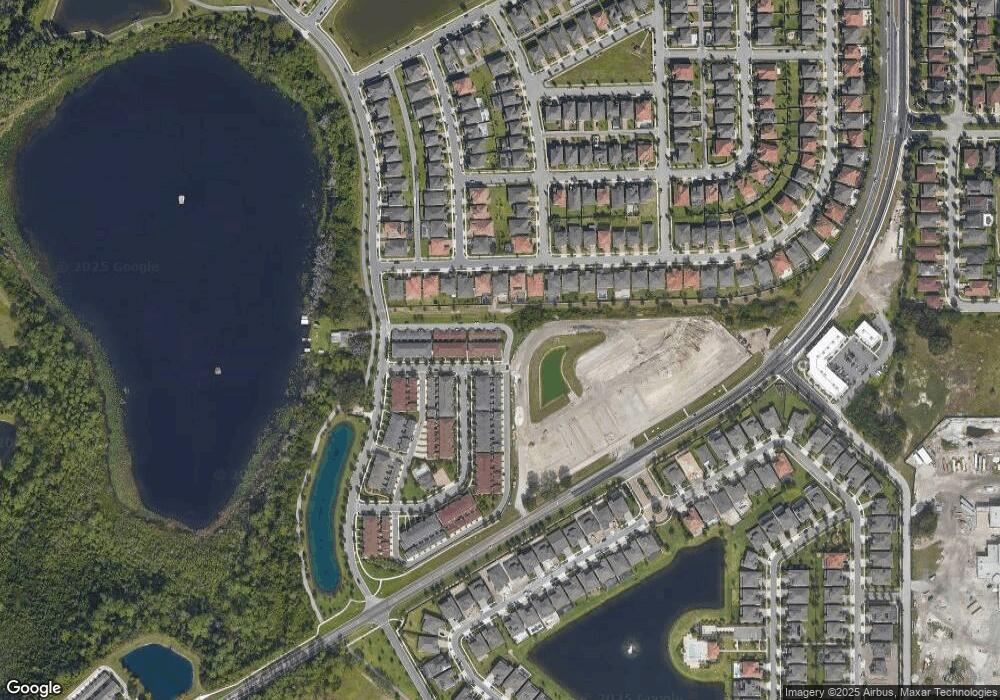
Map
Nearby Homes
- 9257 Outlook Rock Trail
- 9197 Outlook Rock Trail
- 12023 Gold Creek Trail
- 8752 Lookout Pointe Dr
- 12335 Cruxbury Dr
- 11926 Verrazano Dr
- 11922 Angle Pond Ave
- 11850 Sheltering Pine Dr
- 10750 Reams Rd
- 11849 Cave Run Ave
- 12744 Langstaff Dr
- 11837 Cave Run Ave
- 8626 Crescendo Ave
- 11604 Acosta Ave
- 10600 Reams Rd
- 11624 Delmar Ave
- 8582 Powder Ridge Trail
- 8575 Lookout Pointe Dr
- 8625 Coventry Park Way
- 8500 Iron Mountain Trail
- 12301 Via Derna Place
- 12305 Via Derna Place
- 12309 Via Derna Place
- 12313 Via Derna Place
- 12317 Via Derna Place
- 8601 Via Tavoleria Way
- 12321 Via Derna Place
- 12325 Via Derna Place
- 8605 Via Tavoleria Way
- 12329 Via Derna Place
- 8609 Via Tavoleria Way
- 12333 Via Derna Place
- 9245 Outlook Rock Trail
- 9233 Outlook Rock Trail
- 8613 Via Tavoleria Way
- 12337 Via Derna Place
- 8617 Via Tavoleria Way
- 8617 Way
- 9239 Outlook Rock Trail
- 8602 Via Tavoleria Way