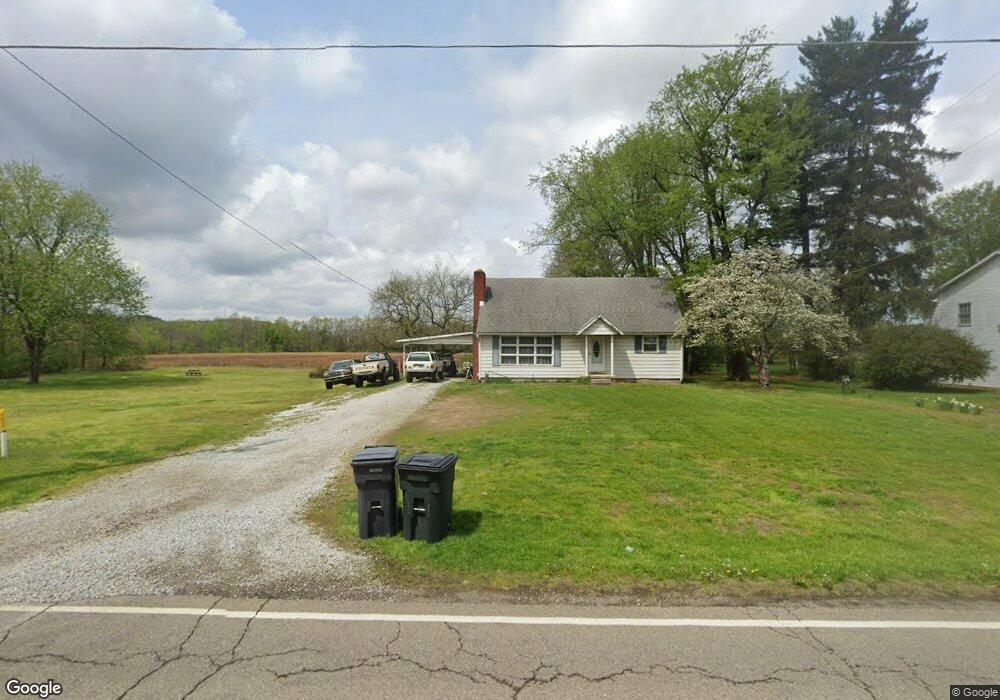
12305 Main St Trinway, OH 43842
Estimated Value: $137,000 - $232,000
2
Beds
1
Bath
1,575
Sq Ft
$122/Sq Ft
Est. Value
About This Home
This home is located at 12305 Main St, Trinway, OH 43842 and is currently estimated at $192,456, approximately $122 per square foot. 12305 Main St is a home located in Muskingum County with nearby schools including Tri-Valley High School.
Ownership History
Date
Name
Owned For
Owner Type
Purchase Details
Closed on
Aug 18, 2023
Sold by
Doyle Eric
Bought by
Doyle Colton H
Current Estimated Value
Home Financials for this Owner
Home Financials are based on the most recent Mortgage that was taken out on this home.
Original Mortgage
$53,000
Outstanding Balance
$51,792
Interest Rate
6.81%
Mortgage Type
New Conventional
Estimated Equity
$140,664
Purchase Details
Closed on
Jan 12, 2022
Sold by
Lynn Doyle Heidi
Bought by
Doyle Eric
Home Financials for this Owner
Home Financials are based on the most recent Mortgage that was taken out on this home.
Original Mortgage
$65,000
Interest Rate
2.73%
Mortgage Type
New Conventional
Purchase Details
Closed on
Jul 8, 2008
Sold by
Wilcox Christia J and Wilcox Timothy I
Bought by
Doyle Eric and Doyle Heidi
Home Financials for this Owner
Home Financials are based on the most recent Mortgage that was taken out on this home.
Original Mortgage
$76,632
Interest Rate
6.1%
Mortgage Type
FHA
Create a Home Valuation Report for This Property
The Home Valuation Report is an in-depth analysis detailing your home's value as well as a comparison with similar homes in the area
Home Values in the Area
Average Home Value in this Area
Purchase History
| Date | Buyer | Sale Price | Title Company |
|---|---|---|---|
| Doyle Colton H | $63,500 | Ambassador Title | |
| Doyle Colton H | $63,500 | Ambassador Title | |
| Doyle Eric | -- | -- | |
| Doyle Eric | $95,000 | Attorney |
Source: Public Records
Mortgage History
| Date | Status | Borrower | Loan Amount |
|---|---|---|---|
| Open | Doyle Colton H | $53,000 | |
| Closed | Doyle Colton H | $53,000 | |
| Previous Owner | Doyle Eric | $65,000 | |
| Previous Owner | Doyle Eric | $76,632 |
Source: Public Records
Tax History Compared to Growth
Tax History
| Year | Tax Paid | Tax Assessment Tax Assessment Total Assessment is a certain percentage of the fair market value that is determined by local assessors to be the total taxable value of land and additions on the property. | Land | Improvement |
|---|---|---|---|---|
| 2024 | $1,660 | $50,015 | $5,565 | $44,450 |
| 2023 | $1,143 | $32,515 | $4,305 | $28,210 |
| 2022 | $1,115 | $32,515 | $4,305 | $28,210 |
| 2021 | $1,099 | $32,515 | $4,305 | $28,210 |
| 2020 | $1,013 | $29,575 | $3,920 | $25,655 |
| 2019 | $1,013 | $29,575 | $3,920 | $25,655 |
| 2018 | $934 | $29,575 | $3,920 | $25,655 |
| 2017 | $838 | $22,995 | $3,920 | $19,075 |
| 2016 | $826 | $23,000 | $3,920 | $19,080 |
| 2015 | $842 | $23,000 | $3,920 | $19,080 |
| 2013 | $913 | $23,000 | $3,920 | $19,080 |
Source: Public Records
Map
Nearby Homes
- 12745 3rd Ave
- 53 W Dave Longaberger Ave
- 510 Chestnut St
- 4797 Narrows Rd
- 10200 N River Rd
- 5010 Narrows Rd
- 10170 N Morrison Rd
- 3695 Hayfield Rd
- 0 Frazeysburg Rd Unit 225043273
- 9520 McGlade School Rd
- 41 acres Twp Rd 71
- 62 acres Twp Rd 71
- 40000 Township Road 1239
- 0 Township Road 1239
- 13300 Mount Zion Rd
- 7360 Jones Rd
- 7300 Jones Rd
- 0 Shannon Rd Unit 225041882
- 130 N State St
- 126 W 3rd St