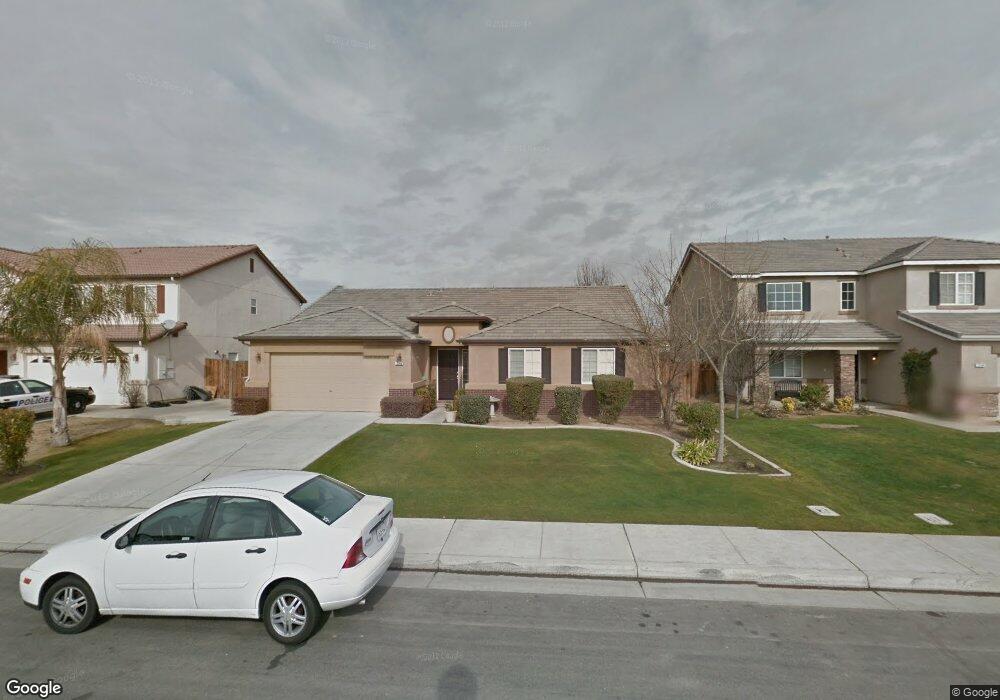
12308 Timberpointe Dr Bakersfield, CA 93312
Estimated Value: $419,860 - $453,000
4
Beds
2
Baths
1,986
Sq Ft
$218/Sq Ft
Est. Value
About This Home
This home is located at 12308 Timberpointe Dr, Bakersfield, CA 93312 and is currently estimated at $432,465, approximately $217 per square foot. 12308 Timberpointe Dr is a home located in Kern County with nearby schools including Norris Elementary School, Norris Middle School, and Frontier High School.
Ownership History
Date
Name
Owned For
Owner Type
Purchase Details
Closed on
Jan 27, 2020
Sold by
Szeflin David S and Szeflin Zarina R
Bought by
Szeflin David S and Szeflin Zarina R
Current Estimated Value
Purchase Details
Closed on
Aug 21, 2008
Sold by
Myers Patrick and Myers Janie
Bought by
Szeflin David S and Szeflin Zarina
Home Financials for this Owner
Home Financials are based on the most recent Mortgage that was taken out on this home.
Original Mortgage
$170,400
Outstanding Balance
$111,508
Interest Rate
6.27%
Mortgage Type
Purchase Money Mortgage
Estimated Equity
$320,957
Purchase Details
Closed on
Nov 22, 2004
Sold by
Centex Homes
Bought by
Myers Patrick and Myers Janie
Home Financials for this Owner
Home Financials are based on the most recent Mortgage that was taken out on this home.
Original Mortgage
$296,483
Interest Rate
5.84%
Mortgage Type
Fannie Mae Freddie Mac
Create a Home Valuation Report for This Property
The Home Valuation Report is an in-depth analysis detailing your home's value as well as a comparison with similar homes in the area
Home Values in the Area
Average Home Value in this Area
Purchase History
| Date | Buyer | Sale Price | Title Company |
|---|---|---|---|
| Szeflin David S | -- | None Available | |
| Szeflin David S | $213,000 | Ticor Title Company Of Ca | |
| Myers Patrick | $296,500 | Commerce Title |
Source: Public Records
Mortgage History
| Date | Status | Borrower | Loan Amount |
|---|---|---|---|
| Open | Szeflin David S | $170,400 | |
| Previous Owner | Myers Patrick | $296,483 |
Source: Public Records
Tax History
| Year | Tax Paid | Tax Assessment Tax Assessment Total Assessment is a certain percentage of the fair market value that is determined by local assessors to be the total taxable value of land and additions on the property. | Land | Improvement |
|---|---|---|---|---|
| 2025 | $4,744 | $274,277 | $90,135 | $184,142 |
| 2024 | $4,652 | $268,900 | $88,368 | $180,532 |
| 2023 | $4,652 | $263,629 | $86,636 | $176,993 |
| 2022 | $4,842 | $258,461 | $84,938 | $173,523 |
| 2021 | $4,726 | $253,394 | $83,273 | $170,121 |
| 2020 | $4,608 | $250,797 | $82,420 | $168,377 |
| 2019 | $4,541 | $250,797 | $82,420 | $168,377 |
| 2018 | $4,430 | $241,060 | $79,220 | $161,840 |
| 2017 | $4,413 | $236,334 | $77,667 | $158,667 |
| 2016 | $4,197 | $231,701 | $76,145 | $155,556 |
| 2015 | $4,139 | $228,222 | $75,002 | $153,220 |
| 2014 | $4,084 | $223,752 | $73,533 | $150,219 |
Source: Public Records
Map
Nearby Homes
- 12321 High Country Dr
- 12207 Quiet Pasture Dr
- 12200 Verdelho Ave
- 12515 Valentano Ave
- 11814 Montague Ave
- 11811 Mantova Ave
- 12414 Lavina Ave
- 7113 Tallywood Dr
- 12715 Windy Ridge Dr
- 12613 Lavina Ave
- 12907 Altair Ct
- 11815 Darlington Ave
- 12900 Altair Ct
- 12911 Altair Ct
- 12606 Knights Bridge Place
- 11807 Darlington Ave Unit 4
- 6702 Wanderer Way
- 7108 Wintersweet Dr
- 7104 Wintersweet Dr
- 6809 Cedar Post Dr
- 12304 Timberpointe Dr
- 12300 Timberpointe Dr
- 12316 Timberpointe Dr
- 12221 Midtowne Dr
- 12307 Midtowne Dr
- 12217 Midtowne Dr
- 12311 Midtowne Dr
- 12309 Timberpointe Dr
- 12301 Timberpointe Dr
- 12210 Timberpointe Dr
- 12313 Timberpointe Dr
- 12213 Midtowne Dr
- 12317 Timberpointe Dr
- 12206 Timberpointe Dr
- 12209 Midtowne Dr
- 6811 Longview Dr
- 6807 Longview Dr
- 12321 Timberpointe Dr
- 12302 Midtowne Dr
- 12306 Great Country Dr
Your Personal Tour Guide
Ask me questions while you tour the home.