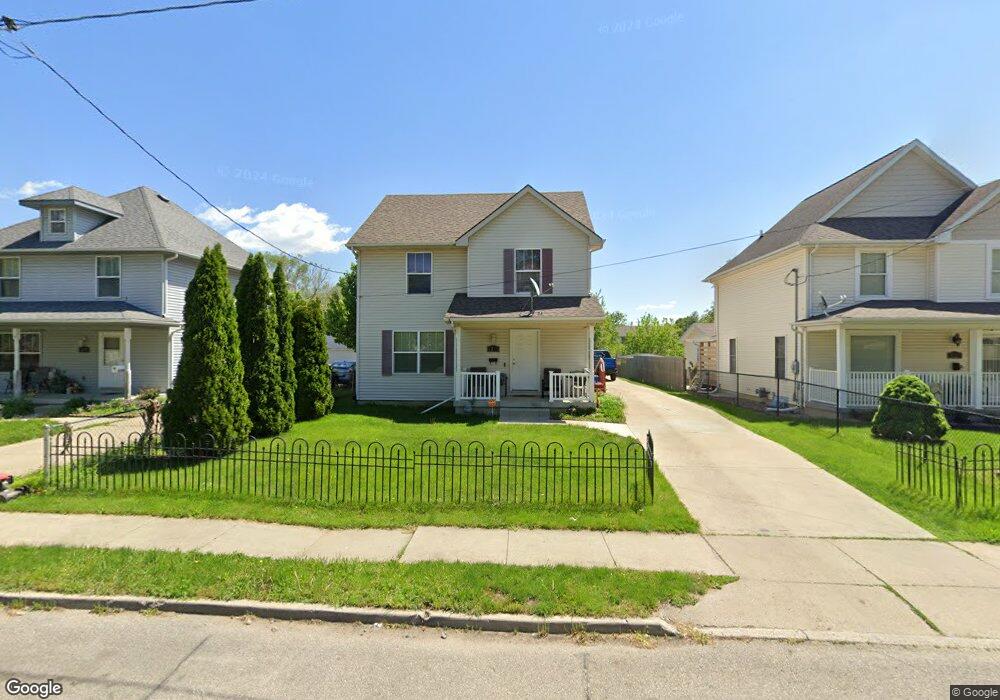
1231 11th St Des Moines, IA 50314
King Irving NeighborhoodEstimated Value: $170,000 - $236,000
4
Beds
2
Baths
1,391
Sq Ft
$147/Sq Ft
Est. Value
About This Home
This home is located at 1231 11th St, Des Moines, IA 50314 and is currently estimated at $204,595, approximately $147 per square foot. 1231 11th St is a home located in Polk County with nearby schools including Moulton Elementary School, Harding Middle School, and North High School.
Ownership History
Date
Name
Owned For
Owner Type
Purchase Details
Closed on
Aug 16, 2021
Sold by
Calderoo Reyes Raul and Rodriquez Margarita Vega
Bought by
Calderon Reyes Raul and Rodriquez Margarita Vega
Current Estimated Value
Home Financials for this Owner
Home Financials are based on the most recent Mortgage that was taken out on this home.
Original Mortgage
$86,000
Outstanding Balance
$78,201
Interest Rate
2.9%
Mortgage Type
New Conventional
Estimated Equity
$126,394
Purchase Details
Closed on
Jun 28, 2008
Sold by
Diverse Solutions Group Llc
Bought by
Calderon Reyes Raul
Home Financials for this Owner
Home Financials are based on the most recent Mortgage that was taken out on this home.
Original Mortgage
$103,750
Interest Rate
6.05%
Mortgage Type
Purchase Money Mortgage
Create a Home Valuation Report for This Property
The Home Valuation Report is an in-depth analysis detailing your home's value as well as a comparison with similar homes in the area
Home Values in the Area
Average Home Value in this Area
Purchase History
| Date | Buyer | Sale Price | Title Company |
|---|---|---|---|
| Calderon Reyes Raul | -- | None Available | |
| Calderon Reyes Raul | $139,500 | None Available |
Source: Public Records
Mortgage History
| Date | Status | Borrower | Loan Amount |
|---|---|---|---|
| Open | Calderon Reyes Raul | $86,000 | |
| Closed | Calderon Reyes Raul | $103,750 |
Source: Public Records
Tax History Compared to Growth
Tax History
| Year | Tax Paid | Tax Assessment Tax Assessment Total Assessment is a certain percentage of the fair market value that is determined by local assessors to be the total taxable value of land and additions on the property. | Land | Improvement |
|---|---|---|---|---|
| 2025 | $2,804 | $176,300 | $14,000 | $162,300 |
| 2024 | $2,804 | $153,000 | $11,900 | $141,100 |
| 2023 | $3,000 | $153,000 | $11,900 | $141,100 |
| 2022 | $2,976 | $136,200 | $9,100 | $127,100 |
| 2021 | $2,804 | $136,200 | $9,100 | $127,100 |
| 2020 | $2,908 | $121,000 | $8,100 | $112,900 |
| 2019 | $2,752 | $121,000 | $8,100 | $112,900 |
| 2018 | $194 | $110,900 | $7,200 | $103,700 |
| 2017 | $194 | $110,900 | $7,200 | $103,700 |
| 2016 | $0 | $112,100 | $7,200 | $104,900 |
| 2015 | $0 | $112,100 | $7,200 | $104,900 |
| 2014 | -- | $100,700 | $7,100 | $93,600 |
Source: Public Records
Map
Nearby Homes