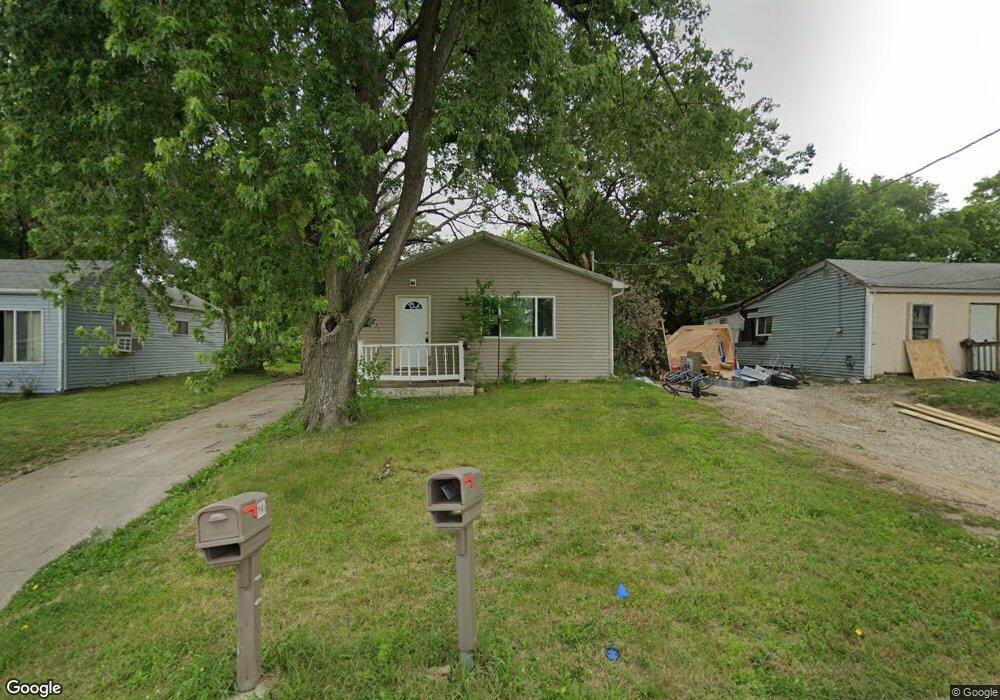
1231 E 36th Ct Des Moines, IA 50317
Gray's Woods NeighborhoodEstimated Value: $166,000 - $196,000
3
Beds
1
Bath
912
Sq Ft
$201/Sq Ft
Est. Value
About This Home
This home is located at 1231 E 36th Ct, Des Moines, IA 50317 and is currently estimated at $183,464, approximately $201 per square foot. 1231 E 36th Ct is a home located in Polk County with nearby schools including Stowe Elementary School, Hoyt Middle School, and East High School.
Ownership History
Date
Name
Owned For
Owner Type
Purchase Details
Closed on
Mar 5, 2024
Sold by
Polk County Sheriff
Bought by
Dlr Holdings Llc
Current Estimated Value
Purchase Details
Closed on
Sep 22, 2009
Sold by
Dynamic Enterprises Corp
Bought by
Henderson Jennifer R
Home Financials for this Owner
Home Financials are based on the most recent Mortgage that was taken out on this home.
Original Mortgage
$89,794
Interest Rate
5.38%
Mortgage Type
FHA
Purchase Details
Closed on
Nov 17, 2008
Sold by
S Cooper Investments Inc
Bought by
Dynamic Enterprises Corporation
Purchase Details
Closed on
Feb 15, 2008
Sold by
Parker Randy J and Parker Jane M
Bought by
S Cooper Investments Inc
Home Financials for this Owner
Home Financials are based on the most recent Mortgage that was taken out on this home.
Original Mortgage
$50,000
Interest Rate
1.75%
Mortgage Type
Purchase Money Mortgage
Purchase Details
Closed on
Jul 13, 2001
Sold by
Morris Deborah L
Bought by
Morris Michael K
Create a Home Valuation Report for This Property
The Home Valuation Report is an in-depth analysis detailing your home's value as well as a comparison with similar homes in the area
Home Values in the Area
Average Home Value in this Area
Purchase History
| Date | Buyer | Sale Price | Title Company |
|---|---|---|---|
| Dlr Holdings Llc | $88,500 | None Listed On Document | |
| Dlr Holdings Llc | $88,500 | None Listed On Document | |
| Henderson Jennifer R | $91,000 | None Available | |
| Dynamic Enterprises Corporation | $13,000 | None Available | |
| S Cooper Investments Inc | $27,000 | None Available | |
| Morris Michael K | -- | -- |
Source: Public Records
Mortgage History
| Date | Status | Borrower | Loan Amount |
|---|---|---|---|
| Previous Owner | Henderson Jennifer R | $89,794 | |
| Previous Owner | S Cooper Investments Inc | $50,000 |
Source: Public Records
Tax History
| Year | Tax Paid | Tax Assessment Tax Assessment Total Assessment is a certain percentage of the fair market value that is determined by local assessors to be the total taxable value of land and additions on the property. | Land | Improvement |
|---|---|---|---|---|
| 2025 | $3,152 | $177,400 | $22,100 | $155,300 |
| 2024 | $3,152 | $95,600 | $19,600 | $76,000 |
| 2023 | $2,960 | $170,700 | $19,600 | $151,100 |
| 2022 | $2,936 | $134,500 | $15,900 | $118,600 |
| 2021 | $2,728 | $134,500 | $15,900 | $118,600 |
| 2020 | $3,623 | $117,900 | $14,000 | $103,900 |
| 2019 | $2,574 | $117,900 | $14,000 | $103,900 |
| 2018 | $2,542 | $104,300 | $12,200 | $92,100 |
| 2017 | $2,436 | $104,300 | $12,200 | $92,100 |
| 2016 | $2,368 | $98,600 | $11,400 | $87,200 |
| 2015 | $2,368 | $98,600 | $11,400 | $87,200 |
| 2014 | $2,284 | $94,700 | $10,800 | $83,900 |
Source: Public Records
Map
Nearby Homes
- 1271 E 36th St
- 3700 E University Ave
- 1305 E 37th St
- 1319 E 37th St
- 1220 E 38th St
- 1320 E 40th St
- 3403 Dubuque Ave
- 1315 E 33rd Ct
- 3809 Indianapolis Ave
- 1257 E 33rd St
- 1337 E 33rd St
- 3910 Indianapolis Ave
- 3253 Dubuque Ave
- 1200 Williams St
- 3121 Mahaska Ave
- 1233 Williams St
- 3113 State Ave
- 4208 Valley Cir
- 1606 E 32nd St
- 4212 Valley Cir
Your Personal Tour Guide
Ask me questions while you tour the home.