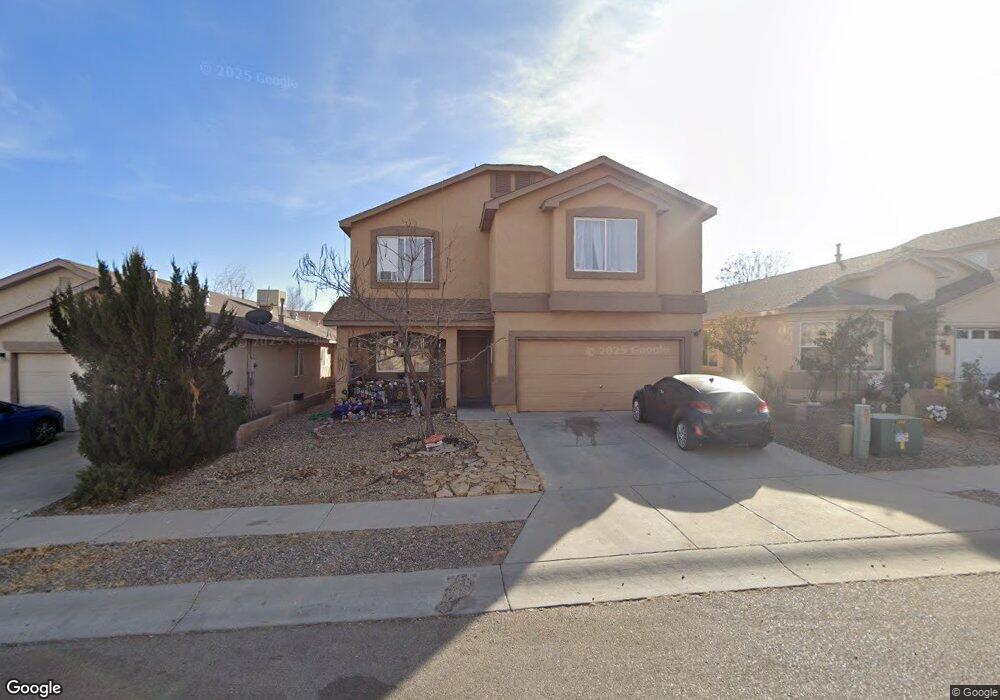
1231 El Rancho Dr SW Albuquerque, NM 87121
Southwest Heights NeighborhoodEstimated Value: $335,000 - $375,000
4
Beds
3
Baths
2,580
Sq Ft
$136/Sq Ft
Est. Value
About This Home
This home is located at 1231 El Rancho Dr SW, Albuquerque, NM 87121 and is currently estimated at $349,710, approximately $135 per square foot. 1231 El Rancho Dr SW is a home located in Bernalillo County with nearby schools including Carlos Rey Elementary School, Tony Hillerman Middle School, and Atrisco Heritage Academy High School.
Ownership History
Date
Name
Owned For
Owner Type
Purchase Details
Closed on
Jan 21, 2011
Sold by
Holguin Julia
Bought by
Tobanche Eduvina
Current Estimated Value
Home Financials for this Owner
Home Financials are based on the most recent Mortgage that was taken out on this home.
Original Mortgage
$155,002
Outstanding Balance
$105,740
Interest Rate
4.87%
Mortgage Type
FHA
Estimated Equity
$243,970
Purchase Details
Closed on
Mar 31, 2009
Sold by
Nance Khalic and Nance Kathy
Bought by
Pulido Eduvina and Holguin Julia
Home Financials for this Owner
Home Financials are based on the most recent Mortgage that was taken out on this home.
Original Mortgage
$165,900
Interest Rate
6%
Mortgage Type
Seller Take Back
Purchase Details
Closed on
Jun 30, 2005
Sold by
D R Horton Inc
Bought by
Nance Khalic and Nance Kathy
Home Financials for this Owner
Home Financials are based on the most recent Mortgage that was taken out on this home.
Original Mortgage
$152,457
Interest Rate
5.67%
Mortgage Type
FHA
Create a Home Valuation Report for This Property
The Home Valuation Report is an in-depth analysis detailing your home's value as well as a comparison with similar homes in the area
Home Values in the Area
Average Home Value in this Area
Purchase History
| Date | Buyer | Sale Price | Title Company |
|---|---|---|---|
| Tobanche Eduvina | -- | Fidelity Natl Title Ins Co | |
| Pulido Eduvina | -- | -- | |
| Pulido Eduvina | $177,900 | Accommodation | |
| Nance Khalic | -- | Albuquerque Title Co |
Source: Public Records
Mortgage History
| Date | Status | Borrower | Loan Amount |
|---|---|---|---|
| Open | Tobanche Eduvina | $155,002 | |
| Previous Owner | Pulido Eduvina | $165,900 | |
| Previous Owner | Nance Khalic | $152,457 |
Source: Public Records
Tax History Compared to Growth
Tax History
| Year | Tax Paid | Tax Assessment Tax Assessment Total Assessment is a certain percentage of the fair market value that is determined by local assessors to be the total taxable value of land and additions on the property. | Land | Improvement |
|---|---|---|---|---|
| 2025 | $2,547 | $62,170 | $11,600 | $50,570 |
| 2024 | $2,547 | $60,359 | $11,262 | $49,097 |
| 2023 | $2,504 | $58,601 | $10,934 | $47,667 |
| 2022 | $2,420 | $56,895 | $10,616 | $46,279 |
| 2021 | $2,339 | $55,238 | $10,307 | $44,931 |
| 2020 | $2,300 | $53,630 | $10,007 | $43,623 |
| 2019 | $2,233 | $52,068 | $9,716 | $42,352 |
| 2018 | $2,153 | $52,068 | $9,716 | $42,352 |
| 2017 | $2,087 | $50,552 | $9,433 | $41,119 |
| 2016 | $2,027 | $47,649 | $8,891 | $38,758 |
| 2015 | $46,262 | $46,262 | $8,632 | $37,630 |
| 2014 | $1,983 | $46,695 | $8,632 | $38,063 |
| 2013 | -- | $47,128 | $8,632 | $38,496 |
Source: Public Records
Map
Nearby Homes
- 1327 Amole Vista St SW
- 9616 Sage Ranch Ct SW
- 9600 Sage Ranch Ct
- 9620 Sage Ranch Ct
- 9520 Sage Ranch Ct SW
- 9609 Sage Ranch Ct SW
- 9508 Sage Ranch Ct SW
- 9504 Sage Ranch Ct
- 9300 Jenny Ave SW
- 1209 Locura Rd SW
- 10312 Cornelia Ct SW
- 10216 Teal Rd SW
- 10423 Jenaro Ct SW
- 10622 Benavides Rd SW
- 9909 Saddlehorn Trail SW
- 9736 Westbound Ave SW
- 10709 Anaya St SW
- 2105 Hermosa Creek Dr SW
- 10427 Sandy Flats Ave SW
- 8600 Kimela Ct SW
- 1235 El Rancho Dr SW
- 1227 El Rancho Dr SW
- 1243 El Rancho Dr SW
- 1223 El Rancho Dr SW
- 1256 Amole Vista St SW
- 1252 Amole Vista St SW
- 1232 El Rancho Dr SW
- 1219 El Rancho Dr SW
- 1228 El Rancho Dr SW
- 1248 Amole Vista St SW
- 1260 Amole Vista St SW
- 1236 El Rancho Dr SW
- 1255 El Rancho Dr SW
- 1224 El Rancho Dr SW
- 1240 El Rancho Dr SW
- 1240 El Rancho Dr SW
- 1244 Amole Vista St SW
- 1259 El Rancho Dr SW
- 1220 El Rancho Dr SW
- 1264 Amole Vista St SW