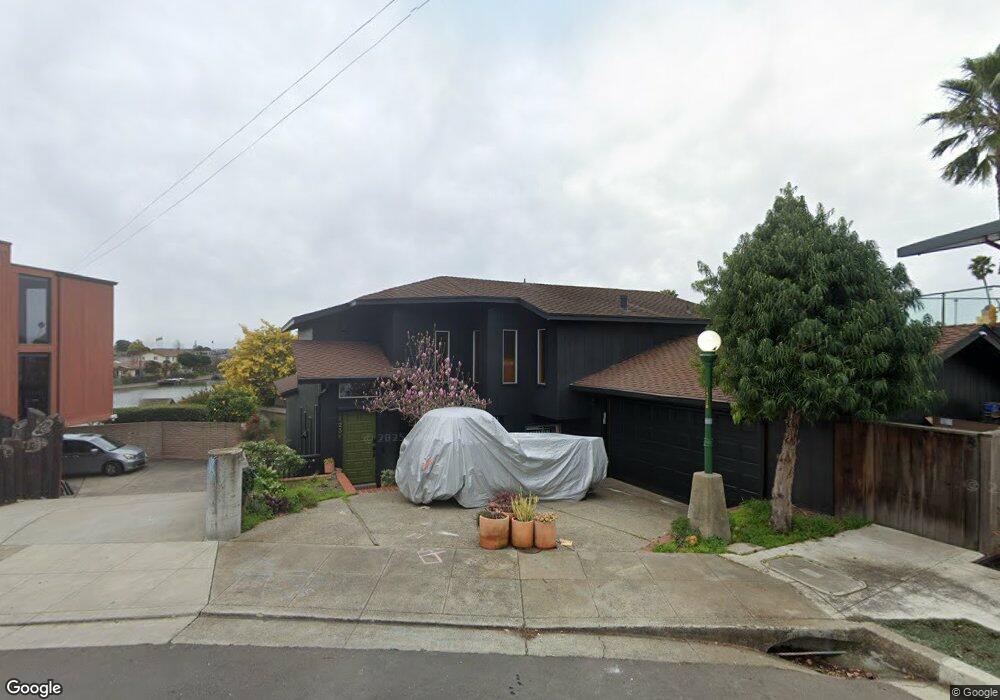
1231 Hawthorne St Alameda, CA 94501
South Shore NeighborhoodEstimated Value: $2,154,000 - $2,245,000
3
Beds
3
Baths
2,300
Sq Ft
$961/Sq Ft
Est. Value
About This Home
This home is located at 1231 Hawthorne St, Alameda, CA 94501 and is currently estimated at $2,210,753, approximately $961 per square foot. 1231 Hawthorne St is a home located in Alameda County with nearby schools including Franklin Elementary, Will C. Wood Middle School, and Encinal Junior/Senior High.
Ownership History
Date
Name
Owned For
Owner Type
Purchase Details
Closed on
Feb 12, 2021
Sold by
Mathur Rajiv and Davis Janet S
Bought by
Pirie Justin Alexander and Pirie Kelly Mcalearney
Current Estimated Value
Home Financials for this Owner
Home Financials are based on the most recent Mortgage that was taken out on this home.
Original Mortgage
$1,100,000
Outstanding Balance
$983,829
Interest Rate
2.7%
Mortgage Type
New Conventional
Estimated Equity
$1,226,924
Purchase Details
Closed on
Oct 8, 2020
Sold by
Davis Janet S
Bought by
Mathur Rajitv and Davis Janet
Purchase Details
Closed on
Nov 23, 2015
Sold by
Davis Janet
Bought by
Mathur Rajiv and Davis Janet S
Home Financials for this Owner
Home Financials are based on the most recent Mortgage that was taken out on this home.
Original Mortgage
$625,000
Interest Rate
3.73%
Mortgage Type
New Conventional
Purchase Details
Closed on
Sep 15, 2015
Sold by
Davis Janet and Estate Of Mary Jane Davis
Bought by
Davis Janet
Create a Home Valuation Report for This Property
The Home Valuation Report is an in-depth analysis detailing your home's value as well as a comparison with similar homes in the area
Home Values in the Area
Average Home Value in this Area
Purchase History
| Date | Buyer | Sale Price | Title Company |
|---|---|---|---|
| Pirie Justin Alexander | $2,100,000 | First American Title Company | |
| Mathur Rajitv | -- | None Available | |
| Davis Janet S | -- | None Available | |
| Mathur Rajiv | -- | Fidelity National Title Co | |
| Davis Janet | -- | None Available |
Source: Public Records
Mortgage History
| Date | Status | Borrower | Loan Amount |
|---|---|---|---|
| Open | Pirie Justin Alexander | $1,100,000 | |
| Previous Owner | Mathur Rajiv | $625,000 |
Source: Public Records
Tax History Compared to Growth
Tax History
| Year | Tax Paid | Tax Assessment Tax Assessment Total Assessment is a certain percentage of the fair market value that is determined by local assessors to be the total taxable value of land and additions on the property. | Land | Improvement |
|---|---|---|---|---|
| 2025 | $29,494 | $2,266,081 | $681,924 | $1,591,157 |
| 2024 | $29,494 | $2,221,520 | $668,556 | $1,559,964 |
| 2023 | $28,281 | $2,184,840 | $655,452 | $1,529,388 |
| 2022 | $27,616 | $2,135,000 | $642,600 | $1,499,400 |
| 2021 | $4,900 | $201,435 | $64,777 | $143,658 |
| 2020 | $4,113 | $206,298 | $64,113 | $142,185 |
| 2019 | $3,394 | $202,253 | $62,856 | $139,397 |
| 2018 | $3,306 | $198,288 | $61,624 | $136,664 |
| 2017 | $3,169 | $194,400 | $60,415 | $133,985 |
| 2016 | $3,150 | $190,589 | $59,231 | $131,358 |
| 2015 | $3,129 | $187,726 | $58,341 | $129,385 |
| 2014 | $2,955 | $184,050 | $57,199 | $126,851 |
Source: Public Records
Map
Nearby Homes
- 901 San Antonio Ave
- 1220 9th St
- 1301 9th St
- 955 Shorepoint Ct Unit 110
- 955 Shorepoint Ct Unit 200
- 950 Shorepoint Ct Unit 100
- 965 Shorepoint Ct
- 1203 Benton St
- 933 Shoreline Dr Unit 203
- 1001 Shoreline Dr Unit 301
- 1059 Santa Clara Ave
- 404 Coral Reef Rd
- 1512 Mozart St
- 1523 Verdi St
- 608 Fortress Isle
- 610 Grand St
- 1017 Lincoln Ave
- 1305 Webster St Unit C309
- 1305 Webster St Unit C102
- 1333 Webster St Unit A107
- 1235 Hawthorne St
- 1200 Hawthorne St
- 1237 Hawthorne St
- 651 Sand Hook Isle
- 1220 Hawthorne St
- 1232 Caroline St
- 1239 Hawthorne St
- 1218 Hawthorne St
- 1236 Hawthorne St
- 1234 Hawthorne St
- 644 Sand Hook Isle
- 1241 Hawthorne St
- 1236 Caroline St
- 1207 Saint Charles St
- 1213 Saint Charles St
- 1234 Caroline St
- 1217 Saint Charles St
- 1240 Hawthorne St
- 1223 Saint Charles St
- 1205 Saint Charles St