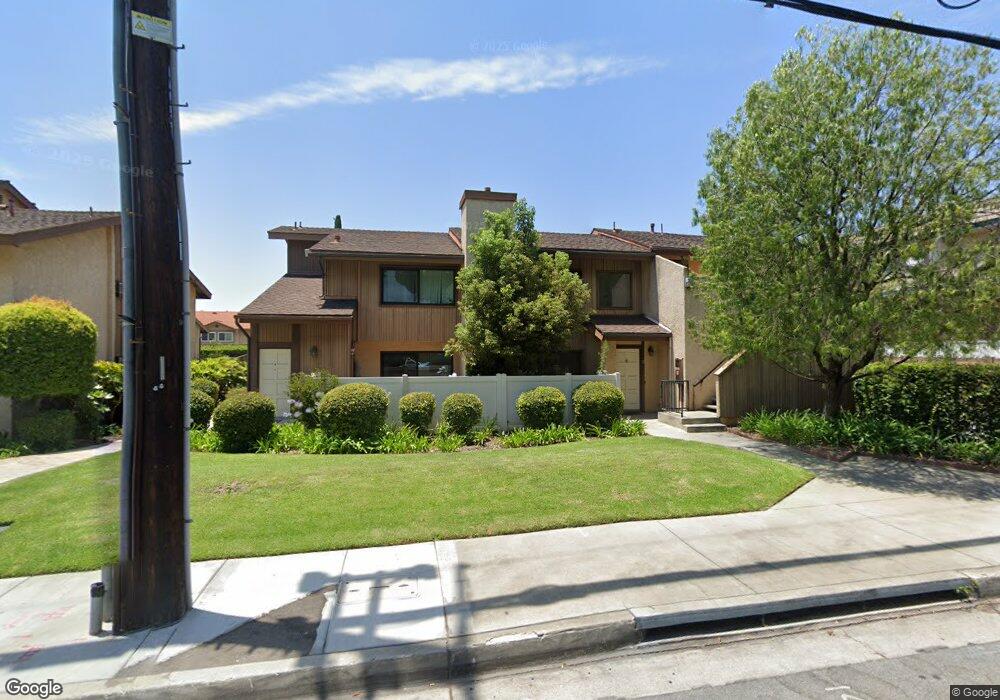
1231 S Golden West Ave Unit 22 Arcadia, CA 91007
Estimated Value: $667,552 - $703,000
2
Beds
2
Baths
1,122
Sq Ft
$608/Sq Ft
Est. Value
About This Home
This home is located at 1231 S Golden West Ave Unit 22, Arcadia, CA 91007 and is currently estimated at $682,138, approximately $607 per square foot. 1231 S Golden West Ave Unit 22 is a home located in Los Angeles County with nearby schools including Longden Elementary School, Oak Avenue Intermediate School, and Temple City High School.
Ownership History
Date
Name
Owned For
Owner Type
Purchase Details
Closed on
Sep 2, 2016
Sold by
Yang Cliff
Bought by
Yuan Yingwei
Current Estimated Value
Home Financials for this Owner
Home Financials are based on the most recent Mortgage that was taken out on this home.
Original Mortgage
$297,000
Interest Rate
4.37%
Mortgage Type
Adjustable Rate Mortgage/ARM
Purchase Details
Closed on
Jan 15, 2013
Sold by
Yang Cliff and Bonnie Yang Living Trust
Bought by
Yang Cliff
Purchase Details
Closed on
Mar 1, 2007
Sold by
Yang Bonnie C
Bought by
Yang Bonnie and Bonnie Yang Living Trust
Purchase Details
Closed on
Feb 1, 2002
Sold by
Chen Pin Hao Kenneth
Bought by
Yang Bonnie C
Purchase Details
Closed on
Mar 10, 1994
Sold by
Yang Chieh Jen Calvin and Yang Bonnie C
Bought by
Chen Pin Hao Kenneth
Create a Home Valuation Report for This Property
The Home Valuation Report is an in-depth analysis detailing your home's value as well as a comparison with similar homes in the area
Home Values in the Area
Average Home Value in this Area
Purchase History
| Date | Buyer | Sale Price | Title Company |
|---|---|---|---|
| Yuan Yingwei | $495,000 | Fatcola | |
| Yang Cliff | -- | None Available | |
| Yang Bonnie | -- | None Available | |
| Yang Bonnie C | $171,000 | -- | |
| Chen Pin Hao Kenneth | $171,000 | -- |
Source: Public Records
Mortgage History
| Date | Status | Borrower | Loan Amount |
|---|---|---|---|
| Previous Owner | Yuan Yingwei | $297,000 |
Source: Public Records
Tax History Compared to Growth
Tax History
| Year | Tax Paid | Tax Assessment Tax Assessment Total Assessment is a certain percentage of the fair market value that is determined by local assessors to be the total taxable value of land and additions on the property. | Land | Improvement |
|---|---|---|---|---|
| 2025 | $6,775 | $574,483 | $434,636 | $139,847 |
| 2024 | $6,775 | $563,219 | $426,114 | $137,105 |
| 2023 | $6,628 | $552,176 | $417,759 | $134,417 |
| 2022 | $6,193 | $541,350 | $409,568 | $131,782 |
| 2021 | $6,316 | $530,737 | $401,538 | $129,199 |
| 2019 | $6,089 | $514,997 | $389,629 | $125,368 |
| 2018 | $5,915 | $504,900 | $381,990 | $122,910 |
| 2016 | $4,073 | $349,413 | $208,047 | $141,366 |
| 2015 | $4,002 | $344,165 | $204,922 | $139,243 |
| 2014 | $3,949 | $337,424 | $200,908 | $136,516 |
Source: Public Records
Map
Nearby Homes
- 1231 S Golden Ave W Unit 30
- 905 W Duarte Rd Unit A
- 833 W Duarte Rd
- 1214 Temple City Blvd Unit 8
- 1222 Temple City Blvd
- 825 W Duarte Rd Unit E
- 1228 Temple City Blvd
- 1006 Arcadia Ave Unit D
- 914 Fairview Ave Unit 15
- 1161 W Duarte Rd Unit 3
- 905 Sunset Blvd Unit B
- 905 Sunset Blvd Unit A
- 9861 E Lemon Ave
- 903 Sunset Blvd Unit A
- 903 Sunset Blvd Unit B
- 6819 Oak Ave
- 631 W Camino Real Ave
- 662 W Norman Ave
- 1107 Okoboji Dr
- 1150 Okoboji Dr
- 1231 S Golden Ave W Unit 20
- 1231 S Golden Ave W Unit 6
- 1231 S Golden Ave W Unit 1
- 1231 S Golden Ave W Unit 8
- 1231 S Golden Ave W Unit 15
- 1231 S Golden Ave W Unit 23
- 1231 S Golden Ave W Unit 5
- 1231 S Golden Ave W Unit 22
- 1231 S Golden Ave W Unit 3
- 1231 S Golden Ave W Unit 25
- 1231 S Golden Ave W Unit 19
- 1231 S Golden Ave W Unit 11
- 1231 S Golden Ave W Unit 16
- 1231 S Golden Ave W Unit 9
- 1231 S Golden Ave W Unit 24
- 1231 S Golden Ave W Unit 4
- 1231 S Golden Ave W Unit 20 222-2561
- 1231 S Golden Ave W Unit 18
- 1231 S Golden Ave W Unit 13
- 1231 S Golden Ave W Unit 10