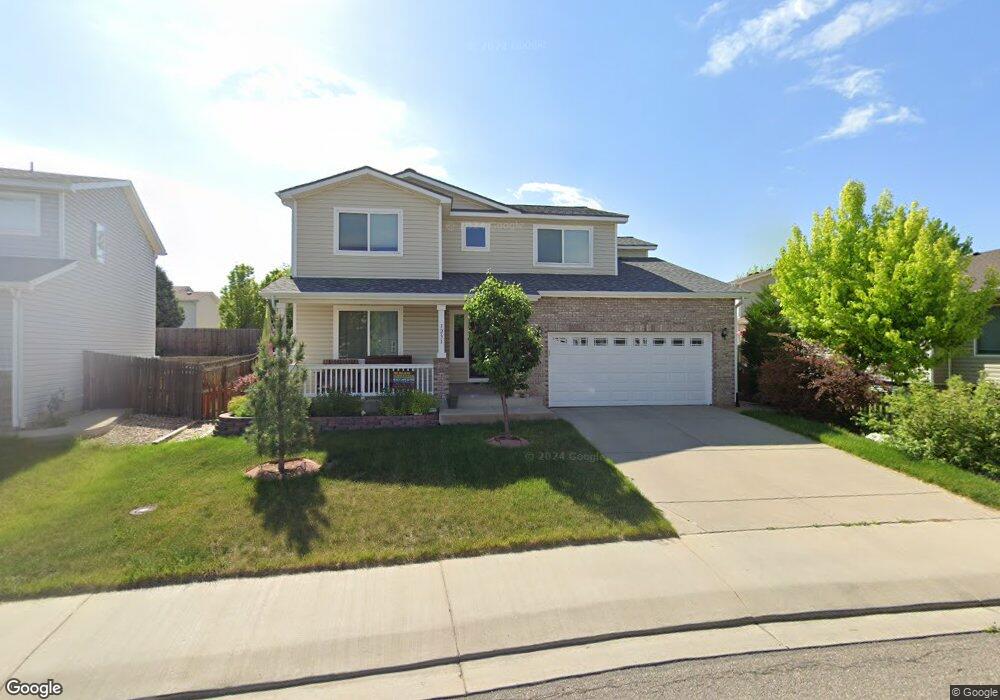
1231 Trout Creek Cir Longmont, CO 80504
East Side NeighborhoodEstimated Value: $564,000 - $612,000
4
Beds
3
Baths
2,178
Sq Ft
$274/Sq Ft
Est. Value
About This Home
This home is located at 1231 Trout Creek Cir, Longmont, CO 80504 and is currently estimated at $597,129, approximately $274 per square foot. 1231 Trout Creek Cir is a home located in Boulder County with nearby schools including Fall River Elementary School, Trail Ridge Middle School, and Skyline High School.
Ownership History
Date
Name
Owned For
Owner Type
Purchase Details
Closed on
Sep 15, 2009
Sold by
Johnson Darrell R and Johnson Elizabeth R
Bought by
Kirchoff Timothy A
Current Estimated Value
Home Financials for this Owner
Home Financials are based on the most recent Mortgage that was taken out on this home.
Original Mortgage
$212,000
Outstanding Balance
$138,718
Interest Rate
5.2%
Mortgage Type
New Conventional
Estimated Equity
$458,411
Purchase Details
Closed on
May 21, 2004
Sold by
Sims Donald L and Sims Heather J
Bought by
Johnson Darrell R
Home Financials for this Owner
Home Financials are based on the most recent Mortgage that was taken out on this home.
Original Mortgage
$202,400
Interest Rate
4.5%
Mortgage Type
Purchase Money Mortgage
Purchase Details
Closed on
Oct 26, 2001
Sold by
Centex Homes
Bought by
Sims Donald L
Home Financials for this Owner
Home Financials are based on the most recent Mortgage that was taken out on this home.
Original Mortgage
$246,352
Interest Rate
6.77%
Create a Home Valuation Report for This Property
The Home Valuation Report is an in-depth analysis detailing your home's value as well as a comparison with similar homes in the area
Home Values in the Area
Average Home Value in this Area
Purchase History
| Date | Buyer | Sale Price | Title Company |
|---|---|---|---|
| Kirchoff Timothy A | $249,500 | Land Title Guarantee Company | |
| Johnson Darrell R | $253,000 | Guardian Title Agency Llc | |
| Sims Donald L | $259,318 | First American Heritage Titl |
Source: Public Records
Mortgage History
| Date | Status | Borrower | Loan Amount |
|---|---|---|---|
| Open | Kirchoff Timothy A | $212,000 | |
| Previous Owner | Johnson Darrell R | $202,400 | |
| Previous Owner | Sims Donald L | $246,352 |
Source: Public Records
Tax History Compared to Growth
Tax History
| Year | Tax Paid | Tax Assessment Tax Assessment Total Assessment is a certain percentage of the fair market value that is determined by local assessors to be the total taxable value of land and additions on the property. | Land | Improvement |
|---|---|---|---|---|
| 2025 | $3,498 | $37,169 | $7,356 | $29,813 |
| 2024 | $3,498 | $37,169 | $7,356 | $29,813 |
| 2023 | $3,450 | $36,569 | $8,120 | $32,133 |
| 2022 | $3,032 | $30,636 | $6,102 | $24,534 |
| 2021 | $3,071 | $31,518 | $6,278 | $25,240 |
| 2020 | $2,809 | $28,915 | $3,861 | $25,054 |
| 2019 | $2,765 | $28,915 | $3,861 | $25,054 |
| 2018 | $2,437 | $25,654 | $3,888 | $21,766 |
| 2017 | $2,404 | $28,361 | $4,298 | $24,063 |
| 2016 | $2,130 | $22,288 | $6,686 | $15,602 |
| 2015 | $2,030 | $19,693 | $4,537 | $15,156 |
| 2014 | $1,839 | $19,693 | $4,537 | $15,156 |
Source: Public Records
Map
Nearby Homes
- 1208 Monarch Dr
- 1201 Trout Creek Cir
- 1219 Cedarwood Dr
- 1290 Fall River Cir
- 1419 Red Mountain Dr Unit 15
- 1419 Red Mountain Dr Unit 116
- 1245 Trail Ridge Rd
- 1503 Prairie Hawk Dr
- 12027 Saint Vrain Rd
- 330 High Point Dr Unit 104
- 829 Independence Dr
- 1504 Pinewood Ct
- 1430 Bluefield Ave
- 1506 Crestwood Cir
- 836 Windflower Dr
- 1267 E 9th Ave
- 1624 Golden Bear Dr
- 1426 Whitehall Dr Unit B
- 930 Button Rock Dr Unit K59
- 722 Ridge Creek Ct
- 1235 Trout Creek Cir
- 1326 Wilkerson Way
- 1330 Wilkerson Way
- 1227 Monarch Dr
- 1231 Monarch Dr
- 1239 Trout Creek Cir
- 1334 Wilkerson Way
- 1235 Monarch Dr
- 1228 Trout Creek Cir
- 1234 Trout Creek Cir
- 1222 Trout Creek Cir
- 1239 Monarch Dr
- 1243 Trout Creek Cir
- 1216 Trout Creek Cir
- 1243 Monarch Dr
- 1327 Wilkerson Way
- 1240 Trout Creek Cir
- 1331 Wilkerson Way
- 1224 Monarch Dr
- 1228 Monarch Dr