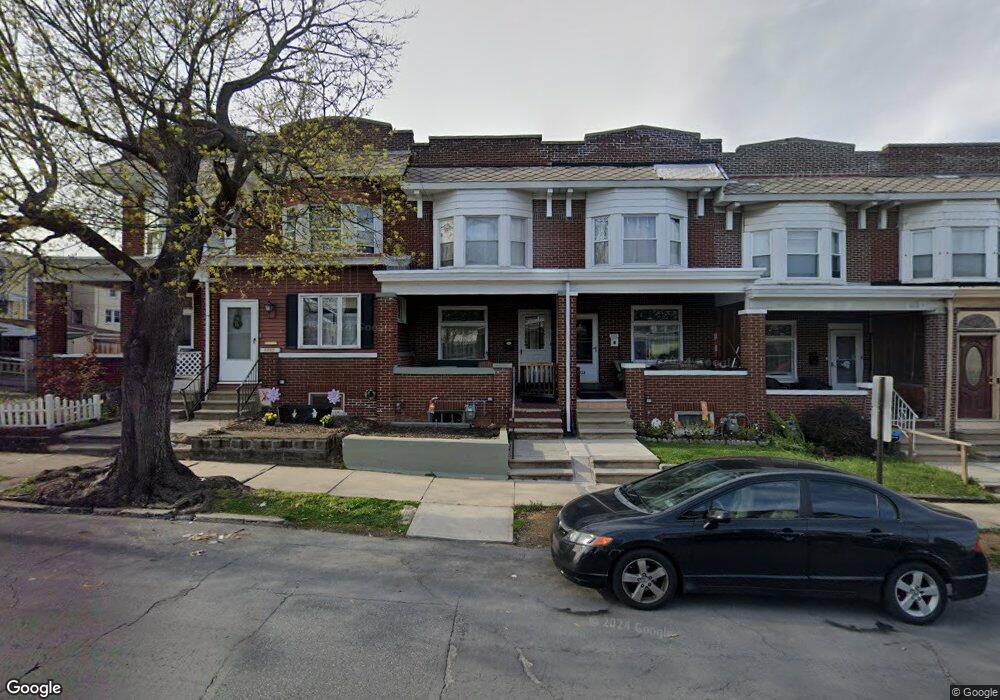
1231 W Allen St Allentown, PA 18102
Center City NeighborhoodEstimated Value: $188,216 - $236,000
3
Beds
1
Bath
1,383
Sq Ft
$154/Sq Ft
Est. Value
About This Home
This home is located at 1231 W Allen St, Allentown, PA 18102 and is currently estimated at $213,054, approximately $154 per square foot. 1231 W Allen St is a home located in Lehigh County with nearby schools including Luis A. Ramos Elementary School, San Rafael Junior High School, and Trexler Middle School.
Ownership History
Date
Name
Owned For
Owner Type
Purchase Details
Closed on
Jul 21, 2017
Sold by
Hein Leonard and Hodgin Hein Susan
Bought by
Hein Leonard and Hodgin Hein Susan
Current Estimated Value
Home Financials for this Owner
Home Financials are based on the most recent Mortgage that was taken out on this home.
Original Mortgage
$98,738
Outstanding Balance
$82,348
Interest Rate
4.03%
Mortgage Type
VA
Estimated Equity
$130,706
Purchase Details
Closed on
Jun 16, 2006
Sold by
Wilson Patricia A
Bought by
Hein Leonard and Hein Susan Hodgin
Home Financials for this Owner
Home Financials are based on the most recent Mortgage that was taken out on this home.
Original Mortgage
$103,500
Interest Rate
6.59%
Mortgage Type
VA
Purchase Details
Closed on
Feb 12, 1999
Sold by
Rung David A and Rung June P
Bought by
Wilson Patricia A
Purchase Details
Closed on
Apr 12, 1978
Bought by
Rung David A and Rung June P
Create a Home Valuation Report for This Property
The Home Valuation Report is an in-depth analysis detailing your home's value as well as a comparison with similar homes in the area
Home Values in the Area
Average Home Value in this Area
Purchase History
| Date | Buyer | Sale Price | Title Company |
|---|---|---|---|
| Hein Leonard | -- | None Available | |
| Hein Leonard | $103,500 | None Available | |
| Wilson Patricia A | $60,000 | -- | |
| Rung David A | $29,900 | -- |
Source: Public Records
Mortgage History
| Date | Status | Borrower | Loan Amount |
|---|---|---|---|
| Open | Hein Leonard | $98,738 | |
| Closed | Hein Leonard | $103,500 |
Source: Public Records
Tax History Compared to Growth
Tax History
| Year | Tax Paid | Tax Assessment Tax Assessment Total Assessment is a certain percentage of the fair market value that is determined by local assessors to be the total taxable value of land and additions on the property. | Land | Improvement |
|---|---|---|---|---|
| 2025 | -- | $79,900 | $6,400 | $73,500 |
| 2024 | -- | $79,900 | $6,400 | $73,500 |
| 2023 | $0 | $79,900 | $6,400 | $73,500 |
| 2022 | $4,021 | $79,900 | $73,500 | $6,400 |
| 2021 | -- | $79,900 | $6,400 | $73,500 |
| 2020 | $36 | $79,900 | $6,400 | $73,500 |
| 2019 | $36 | $79,900 | $6,400 | $73,500 |
| 2018 | $36 | $79,900 | $6,400 | $73,500 |
| 2017 | -- | $79,900 | $6,400 | $73,500 |
| 2016 | -- | $79,900 | $6,400 | $73,500 |
| 2015 | -- | $79,900 | $6,400 | $73,500 |
| 2014 | -- | $79,900 | $6,400 | $73,500 |
Source: Public Records
Map
Nearby Homes
- 615 N 12th St
- 1144 W Allen St
- 631 N Poplar St
- 1357 W Liberty St
- 1042 W Allen St
- 719 1/2 N 11th St
- 719 N 11th St
- 1038 W Green St
- 753 N 11th St
- 1429 W Liberty St
- 513 N Howard St
- 1010 W Tilghman St
- 612 N 10th St
- 746 N 10th St
- 514 N Hazel St
- 739 N Hazel St
- 1141 Emmett St
- 605 N 16th St
- 605 1/2 N 16th St
- 329 N 15th St
- 1229 W Allen St
- 1233 W Allen St
- 1227 W Allen St
- 1225 W Allen St
- 1237 W Allen St
- 1239 W Allen St
- 614 N Jefferson St
- 1223 W Allen St
- 616 N Jefferson St
- 1221 W Allen St
- 618 N Jefferson St
- 1219 W Allen St
- 607 N 13th St
- 605 N 13th St
- 620 N Jefferson St
- 611 N 13th St
- 1217 W Allen St
- 1234 W Allen St
- 609 N 13th St
- 1232 W Allen St