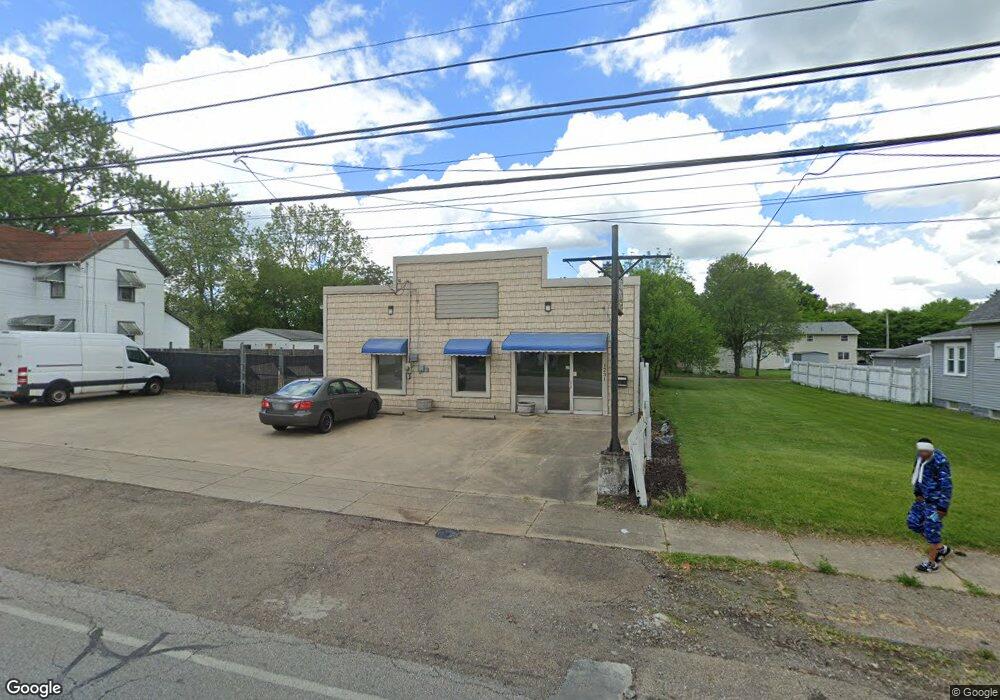
1231 W Waterloo Rd Akron, OH 44314
Kenmore NeighborhoodEstimated Value: $106,304
Studio
--
Bath
1,920
Sq Ft
$55/Sq Ft
Est. Value
About This Home
This home is located at 1231 W Waterloo Rd, Akron, OH 44314 and is currently priced at $106,304, approximately $55 per square foot. 1231 W Waterloo Rd is a home located in Summit County with nearby schools including Kenmore Garfield Community Learning Center, Imagine Akron Academy, and Sam Salem Community Learning Center.
Ownership History
Date
Name
Owned For
Owner Type
Purchase Details
Closed on
Nov 22, 2022
Sold by
Srp Rentals Llc
Bought by
Stj Group Llc
Current Estimated Value
Purchase Details
Closed on
Aug 7, 2015
Sold by
Residential Construction Specialists Inc
Bought by
Srp Rentals Llc
Purchase Details
Closed on
Mar 7, 2012
Sold by
Liddle Kimberly J and Hance Deborah L
Bought by
Residential Construction Specialists Inc
Purchase Details
Closed on
Aug 31, 2009
Sold by
School Russell C and School Carol A
Bought by
Liddle Kimberly J and Hance Deborah L
Purchase Details
Closed on
Jun 22, 2004
Sold by
School Russell C and School Carol A
Bought by
School Russell C and School Carol A
Purchase Details
Closed on
May 6, 2002
Sold by
School Construction Inc
Bought by
School Russell and School Carol
Purchase Details
Closed on
Aug 29, 1996
Sold by
Long Robert B
Bought by
School Const Inc
Create a Home Valuation Report for This Property
The Home Valuation Report is an in-depth analysis detailing your home's value as well as a comparison with similar homes in the area
Home Values in the Area
Average Home Value in this Area
Purchase History
| Date | Buyer | Sale Price | Title Company |
|---|---|---|---|
| Stj Group Llc | $87,000 | Accurate Abstracting | |
| Srp Rentals Llc | $60,000 | First Security Title | |
| Residential Construction Specialists Inc | $56,000 | First Security Title Corpora | |
| Liddle Kimberly J | -- | Attorney | |
| School Russell C | -- | Attorney | |
| School Russell C | -- | -- | |
| School Russell | -- | -- | |
| School Const Inc | $75,000 | -- |
Source: Public Records
Tax History
| Year | Tax Paid | Tax Assessment Tax Assessment Total Assessment is a certain percentage of the fair market value that is determined by local assessors to be the total taxable value of land and additions on the property. | Land | Improvement |
|---|---|---|---|---|
| 2025 | $2,123 | $23,478 | $5,005 | $18,473 |
| 2024 | $2,022 | $23,478 | $5,005 | $18,473 |
| 2023 | $2,123 | $23,478 | $5,005 | $18,473 |
| 2022 | $2,065 | $23,478 | $5,005 | $18,473 |
| 2021 | $2,068 | $23,478 | $5,005 | $18,473 |
| 2020 | $2,042 | $23,480 | $5,010 | $18,470 |
| 2019 | $1,161 | $11,780 | $5,620 | $6,160 |
| 2018 | $1,155 | $11,780 | $5,620 | $6,160 |
| 2017 | $1,185 | $11,780 | $5,620 | $6,160 |
| 2016 | $1,176 | $12,380 | $5,920 | $6,460 |
| 2015 | $1,185 | $12,380 | $5,920 | $6,460 |
| 2014 | $1,171 | $12,380 | $5,920 | $6,460 |
| 2013 | $1,014 | $10,330 | $5,030 | $5,300 |
Source: Public Records
Map
Nearby Homes
- 1174 Kohler Ave
- 1147 Mcintosh Ave
- 1178 Welsh Ave
- 1237 Mcintosh Ave
- 1266 Kohler Ave
- 2465 28th St SW
- 1277 Weiser Ave
- 1315 Kohler Ave
- 1296 Weiser Ave
- 1203 Sarlson Ave
- 1288 Nestor Ave
- 1202 California Ave
- 2387 29th St SW Unit 2389
- 1211 California Ave
- 1207 California Ave
- 1284 Kentucky Ave
- 1144 Sutherland Ave
- 2354 21st St SW
- 2343 18th St SW
- 2278 26th St SW
- 1227 W Waterloo Rd
- 1243 W Waterloo Rd
- 1223 W Waterloo Rd
- 1162 Kohler Ave
- 1158 Kohler Ave
- 1166 Kohler Ave
- 1215 W Waterloo Rd
- 1247 W Waterloo Rd
- 1247 W Waterloo Rd Unit 5
- 1150 Kohler Ave
- 1170 Kohler Ave
- 1146 Kohler Ave
- 1236 W Waterloo Rd
- 1240 W Waterloo Rd
- 1211 W Waterloo Rd Unit 5
- 1211 W Waterloo Rd Unit 6
- 1211 W Waterloo Rd Unit 3
- 1211 W Waterloo Rd Unit 1
- 1211 W Waterloo Rd Unit 4
- 1211 W Waterloo Rd
Your Personal Tour Guide
Ask me questions while you tour the home.