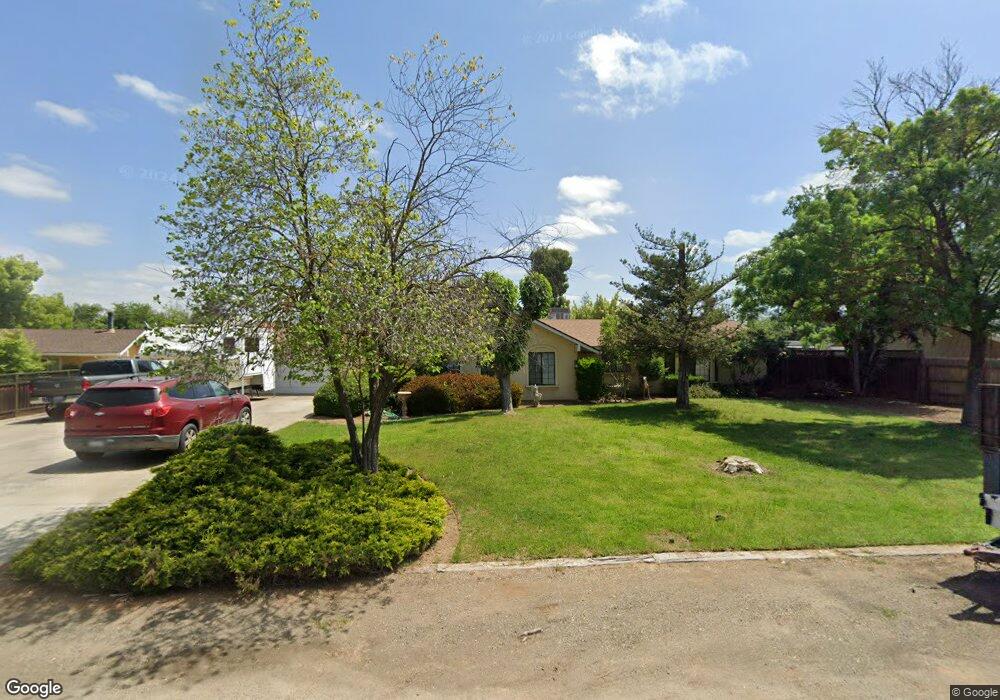
12315 Cranberry Rd Madera, CA 93636
Estimated Value: $475,131 - $537,000
3
Beds
2
Baths
1,936
Sq Ft
$261/Sq Ft
Est. Value
About This Home
This home is located at 12315 Cranberry Rd, Madera, CA 93636 and is currently estimated at $505,533, approximately $261 per square foot. 12315 Cranberry Rd is a home located in Madera County with nearby schools including Webster Elementary School, Ranchos Middle School, and Liberty High School.
Ownership History
Date
Name
Owned For
Owner Type
Purchase Details
Closed on
Jul 21, 2016
Sold by
Luis Steven
Bought by
Luis Steven
Current Estimated Value
Home Financials for this Owner
Home Financials are based on the most recent Mortgage that was taken out on this home.
Original Mortgage
$201,000
Outstanding Balance
$160,251
Interest Rate
3.54%
Mortgage Type
New Conventional
Estimated Equity
$345,282
Purchase Details
Closed on
May 23, 2000
Sold by
Luis Christina
Bought by
Luis Steven
Home Financials for this Owner
Home Financials are based on the most recent Mortgage that was taken out on this home.
Original Mortgage
$122,937
Interest Rate
8.15%
Mortgage Type
Stand Alone First
Purchase Details
Closed on
May 9, 2000
Sold by
Pillow David A and Pillow Joan R
Bought by
Luis Steven
Home Financials for this Owner
Home Financials are based on the most recent Mortgage that was taken out on this home.
Original Mortgage
$122,937
Interest Rate
8.15%
Mortgage Type
Stand Alone First
Create a Home Valuation Report for This Property
The Home Valuation Report is an in-depth analysis detailing your home's value as well as a comparison with similar homes in the area
Home Values in the Area
Average Home Value in this Area
Purchase History
| Date | Buyer | Sale Price | Title Company |
|---|---|---|---|
| Luis Steven | -- | Lawyers Title Company | |
| Luis Steven | -- | Chicago Title Co | |
| Luis Steven | $140,500 | Chicago Title Co |
Source: Public Records
Mortgage History
| Date | Status | Borrower | Loan Amount |
|---|---|---|---|
| Open | Luis Steven | $201,000 | |
| Closed | Luis Steven | $122,937 |
Source: Public Records
Tax History
| Year | Tax Paid | Tax Assessment Tax Assessment Total Assessment is a certain percentage of the fair market value that is determined by local assessors to be the total taxable value of land and additions on the property. | Land | Improvement |
|---|---|---|---|---|
| 2025 | $3,494 | $232,168 | $53,780 | $178,388 |
| 2023 | $3,494 | $223,155 | $51,693 | $171,462 |
| 2022 | $2,397 | $218,780 | $50,680 | $168,100 |
| 2021 | $3,148 | $214,491 | $49,687 | $164,804 |
| 2020 | $3,145 | $212,293 | $49,178 | $163,115 |
| 2019 | $2,991 | $208,131 | $48,214 | $159,917 |
| 2018 | $2,933 | $204,051 | $47,269 | $156,782 |
| 2017 | $2,908 | $200,051 | $46,343 | $153,708 |
| 2016 | $3,743 | $196,130 | $45,435 | $150,695 |
| 2015 | $2,192 | $193,185 | $44,753 | $148,432 |
| 2014 | $2,742 | $189,402 | $43,877 | $145,525 |
Source: Public Records
Map
Nearby Homes
- 4171 Agnes Ln
- 849 Livio Way
- 36313 Avenue 12
- 36620 Avenue 12
- 11850 Topper Rd
- 37206 Avenue 12
- 37303 Berkshire Dr
- 37367 Marciel Ave
- 588 Overstone Ave
- 649 Wood Crest Ave
- 673 Redrock Dr
- 116 Aria Ave S
- 4593 Orchard Hills Rd
- 4286 Oak Knoll Rd
- 944 Horizon Dr
- 835 Fir St W
- 836 Winchell Way W
- 1007 Little Canyon Dr
- 34937 Avenue 13
- 35570 Avenue 14
- 12293 Cranberry Rd
- 12337 Cranberry Rd
- 12352 Road 36 1/2
- 12352 Road 36 1 2
- 12368 Road 36 1/2
- 12336 Road 36 1/2
- 12271 Cranberry Rd
- 36438 Cloverleaf Ave
- 12336 Road 36 1 2
- 12314 Cranberry Rd
- 12368 Road 36 1 2
- 12294 Cranberry Rd
- 12336 Cranberry Rd
- 12386 Road 36 1/2
- 12318 Road 36 1/2
- 12272 Cranberry Rd
- 36390 Cloverleaf Ave
- 12249 Cranberry Rd
- 12300 Road 36 1 2
- 12300 Road 36 1/2
Your Personal Tour Guide
Ask me questions while you tour the home.